Sales Agreements
The Sales agreements widget helps sellers protect the revenue their agreements already promise. Built into the Commerce Console, the widget shows where each agreement stands, surfaces the ones quietly losing value, and lets teams act before that revenue is gone. Rather than expiring without a conversation or going under-used, agreements stay in view and in play.
Acting early starts with knowing where to look. Agreements are flagged on three clear signals: ending soon, used less than expected at this point in the term, or not used recently. Sellers can notify sales agents directly from the widget, turning a status into an owned action.
This revenue costs nothing to win back, as the terms are already agreed. Committed volume becomes something teams can manage rather than track, and every agreement caught in time is a chance to prevent revenue loss.
The widget is available in Sana Admin, under Commerce Console > Performance & growth, alongside other performance widgets.
It complements two other parts of Sana’s sales agreements functionality:
-
ERP-based sales agreements: The underlying feature that lets B2B customers order against contracts negotiated in your ERP, with special pricing and discounts applied automatically.
-
The buyer-facing sales agreements widget: A widget on the My account dashboard in the Sana webstore that lets logged-in B2B customers track their own agreements, usage, and remaining commitments.
The Sales agreements widget described in this manual is the seller-facing counterpart: instead of showing one customer their own agreements, it gives your sales team a comprehensive overview of all customers and their agreements that are at risk, so you can prioritize where to act.
Prerequisites
Before the widget can show data, the following must be true:
-
The sales agreements feature is enabled for your webstore.
-
Your connected ERP supports sales agreements.
-
Consent has been granted to retrieve sales agreements data. An administrator can review this under Consent Management in Sana Admin.
If any of these conditions aren’t met, the widget shows an explanatory message instead of data. See When There Is No Data to Show below.
Key Features
-
Sales agreements risk summary: An overview of all active sales agreements with your customers that are at risk or require attention.
-
Automatic risk detection: Sales agreements are automatically grouped into three risk categories – Expiring soon, Low utilization, and No recent activity – so sellers don’t have to check each agreement manually. Sellers know exactly where value is slipping, whether an agreement is ending within 45 days, behind on its committed volume, or sitting unused.
-
One-click drill-down: Each risk category opens a pre-filtered Sales agreements overview page. View all agreements opens the full, unfiltered list.
-
Searchable, filterable overview: The overview page can be searched by company (customer) or agreement, and filtered by agreement type and status, to help sellers quickly narrow down to the agreements that matter.
-
Rich per-agreement detail: Value, remaining value, consumption, start and expiry dates, and the assigned sales agent are all shown for every agreement, with explanations of how some values are calculated. This helps sellers prioritize the biggest opportunities first.
-
Built-in sales agent notification: The sales agent who owns the customer relationship can be notified by email directly from the widget, turning a flagged agreement into an owned action. The agents are asked to review sales agreements that require attention and follow up with the customer.
-
Automatic utilization and consumption calculations: Utilization and consumption are calculated from ERP data using a consistent, transparent methodology, rather than requiring manual spreadsheet tracking.
Key Benefits for Customers
Although the widget itself is seller-facing, the customers behind those sales agreements benefit as well:
-
Sales agreements are less likely to go to waste: Because sellers can see at-risk agreements early, customers are more likely to be reminded to use committed pricing and discounts before an agreement expires.
-
Proactive outreach instead of missed opportunities: When an agreement is expiring soon or under-utilized, the customer’s sales agent can be notified and reach out before the customer misses out on negotiated terms.
-
Greater confidence in negotiated terms: Customers can trust that their committed quantities, amounts, and discounts are being actively tracked and honored on the merchant’s side.
Key Benefits for Merchants
-
Less revenue leakage: Expiring, under-utilized, and inactive agreements are surfaced before they expire unused, helping merchants capture revenue that would otherwise be lost.
-
Higher agreement-driven digital GMV: By prompting timely action on at-risk agreements, the widget helps increase the share of digital revenue driven by sales agreements.
-
Prioritized, data-driven action: Instead of manually reviewing every agreement, sellers can focus their time on the agreements the widget flags as needing attention first.
-
Lower operational overhead: Risk detection, calculations, and filtering are handled automatically, eliminating the need for manual spreadsheets or some extra ERP queries.
-
Faster time to action: One-click filtering and a built-in email notification workflow let sellers go from identifying a risk to notifying the responsible sales agent in a few clicks.
-
Centralized, real-time visibility: All customers and their agreements that require attention are visible in one place in Sana Admin, without switching between ERP screens or reports.
What the Widget Shows You
At the top of the widget, Sana shows the total number of sales agreements. Right below the total, two summary figures show how those agreements break down:
-
Agreements that require attention: Shown with a warning icon – the number of agreements falling into one or more risk categories.
-
Agreements on track: Shown with a checkmark icon – the number of agreements with no identified risk.
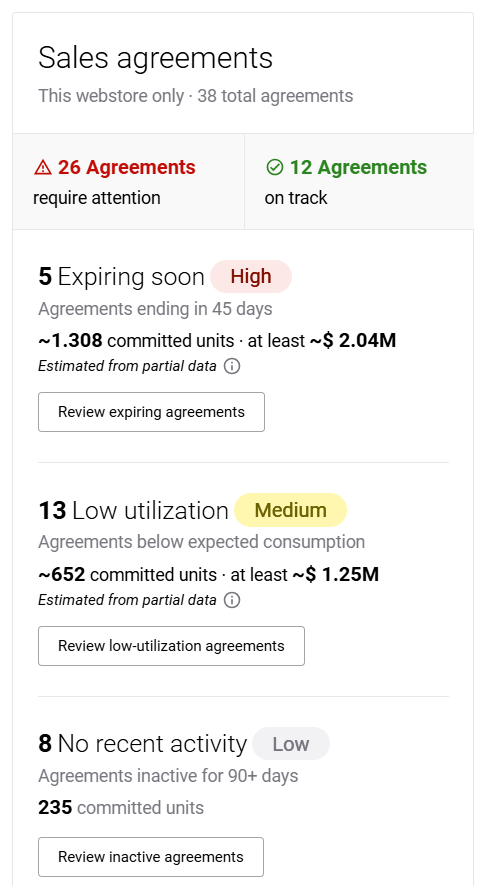
Below the summary, agreements are grouped into three risk categories, each with a colored priority tag, a short description, a summary of committed units and value, and a button that opens the filtered sales agreements overview page. An agreement can appear in more than one category at the same time.
Risk Categories
Expiring Soon (High Priority)
Sales agreements ending within 45 days. This category requires the agreement to have an end date.
-
The number of agreements expiring soon.
-
The approximate number of committed units and their total value, for example, "~1,308 committed units · at least ~€347.32K".
-
A Review expiring agreements button that opens the Sales agreements overview page filtered to this category.
Low Utilization (Medium Priority)
Sales agreements whose actual usage is behind where it should be at this point in the agreement’s term. This category requires the agreement to have both a start and an end date.
-
The number of agreements with low utilization.
-
The approximate number of committed units and their total value.
-
A Review low-utilization agreements button that opens the Sales agreements overview page filtered to this category.
No Recent Activity (Low Priority)
Sales agreements with no activity for 90 days or more.
-
The number of inactive agreements.
-
The number of committed units.
-
A Review inactive agreements button that opens the Sales agreements overview page filtered to this category.
Taking Action from the Widget
Each risk category button is a shortcut into the Sales agreements overview page, pre-filtered to that category. For example, clicking Review expiring agreements opens the Sales agreements overview page filtered to agreements expiring within 45 days.
Click View all agreements, below the risk categories, to open the Sales agreements overview page with no filters applied and see every sales agreement that requires attention from all three categories.
The Sales Agreements Overview Page
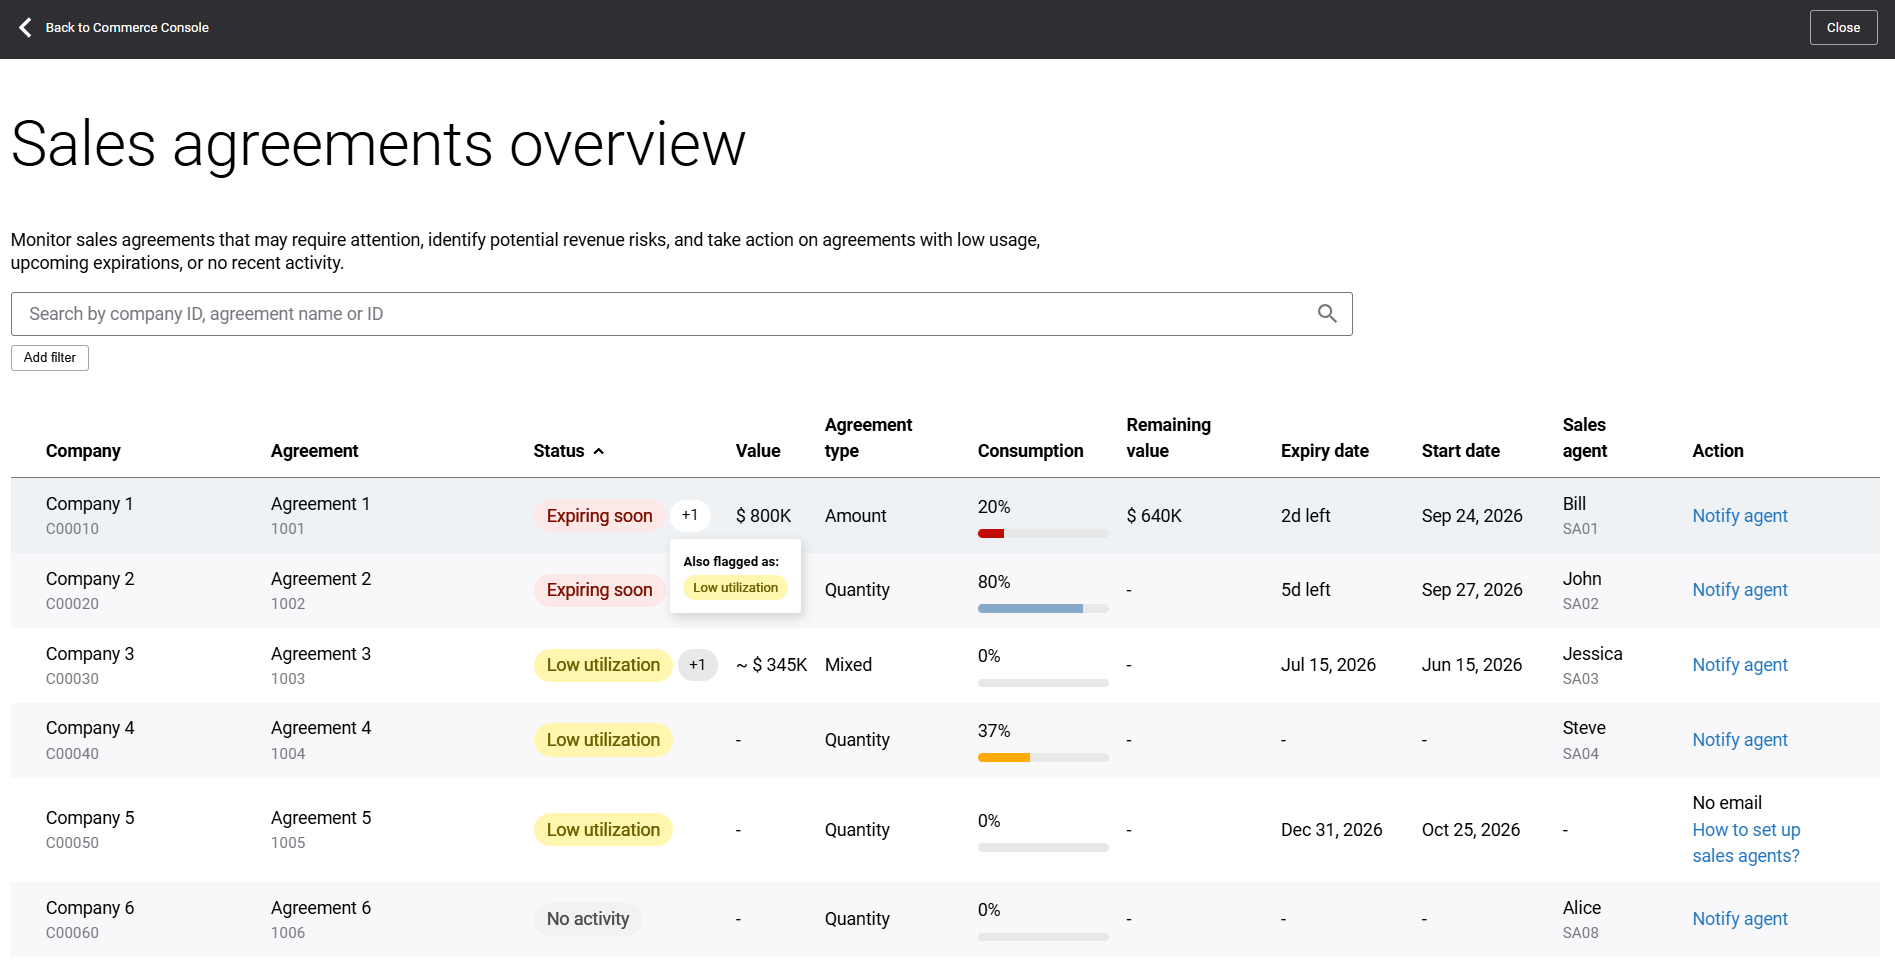
The Sales agreements overview page is where you investigate and act on the agreements the widget has flagged. Use it to monitor sales agreements that may require attention, identify potential revenue risks, and take action on agreements with low usage, upcoming expirations, or no recent activity.
Search, Filter, and Sort
-
Use the search bar to find a specific agreement by company (customer) ID, sales agreement name or ID.
-
Click Add filter to filter by Agreement type (Amount, Quantity, or Mixed) or by Status (Expiring soon, Low utilization, No activity, or Active).
-
Active filters appear as removable chips above the table – for example, Status: Expiring soon. Click Clear all to remove every filter at once.
-
Click on a column header to sort the sales agreements by any criterion.
Fields On the Sales Agreements Overview Page
Each row on the overview page represents one sales agreement and includes the following fields:
| Field | Description |
|---|---|
| Company | The B2B customer (name and ID) the sales agreement was signed with. |
| Agreement | The sales agreement’s title and ID. |
| Status | Expiring soon, Low utilization, No activity, or Active.
An agreement can have more than one status at once. The “+N” badge next to the status shows how many others apply. Click on the badge to see them. For more information, see Risk Categories above. |
| Value | The estimated commercial value of the agreement. Hover over the value to see how it was calculated for this agreement. What is shown depends on the agreement type:
|
| Agreement type | Quantity, Amount, or Mixed. |
| Consumption | The agreement’s consumption percentage, shown as a percentage with a colored progress bar. Hover over it to see how it was calculated. The bar color reflects how consumption compares to what is expected at this point in the agreement term:
|
| Remaining value | The estimated value still remaining on the agreement. Hover over it to see how it was calculated. It follows the same exact / approximate (~) / dash (–) pattern as Value, based on agreement type. |
| Expiry date | The agreement’s end date.
When the expiration date is 45 days or less away, a counter displays the number of days remaining, for example, 7d left. |
| Start date | The agreement’s start date. |
| Sales agent | The sales agent (name and ID) assigned to this customer in your ERP. Shows a dash (–) if no agent is assigned. |
| Action | If the customer has an assigned sales agent in your ERP, you can notify that agent by email using the Sales Agreement Requires Attention e-mail template. This column shows one of three states:
|
Sales Agreements Data
How We Calculate Low Utilization and Consumption
Low utilization
We compare how much of the agreement term has elapsed to how much of the agreement has actually been used (its consumption). If the percentage of time elapsed is greater than the consumption percentage, the agreement is flagged as Low utilization.
Example
-
Agreement start date: January 1, 2026
-
Agreement end date: December 31, 2026
-
Current date: July 1, 2026
At the halfway point of the year, 50% of the agreement term has elapsed, so 50% consumption is expected. If actual consumption is lower than that, the agreement status is Low utilization.
Consumption
Consumption is calculated per agreement line and then averaged. For example, if an agreement has these two lines:
-
10 out of 40 kg of goods purchased (25% utilization)
-
$7,500 out of $10,000 purchased (75% utilization)
The agreement total utilization is the arithmetic mean of the line-level utilization rates: (25% + 75%) ÷ 2 = 50%.
When There Is No Data to Show
The widget behavior depends on data availability and system conditions. Instead of data, you may see an explanatory message when:
-
There are no sales agreements.
-
The sales agreements feature is disabled.
-
Your ERP does not support sales agreements.
-
Consent to retrieve sales agreements has not been granted.
-
You may also see no risk data when every sales agreement is active and on track – in that case, the widget lets you know there’s nothing that currently needs your attention.
Estimated and Unavailable Data
-
Estimated from partial data: May appear on the widget when a value can’t be fully calculated, for example, when there are sales agreements based on both amount and quantity, and quantity-based agreements have no pricing available.
-
Pricing information is unavailable: May appear when you hover over Value or Remaining value for a Mixed-type agreement on the overview page, and quantity-based agreements have no pricing available.
Both messages appear for the same reason: when an agreement has lines based on both amount and quantity, the system can’t calculate a single total value for the agreement because pricing information isn't available for its quantity-based lines.
Related Articles
- Sales Agreements (feature)
- Sales Agreements (buyer widget)
- Commerce Console
- Consent Management


