Key Digital Business Metrics
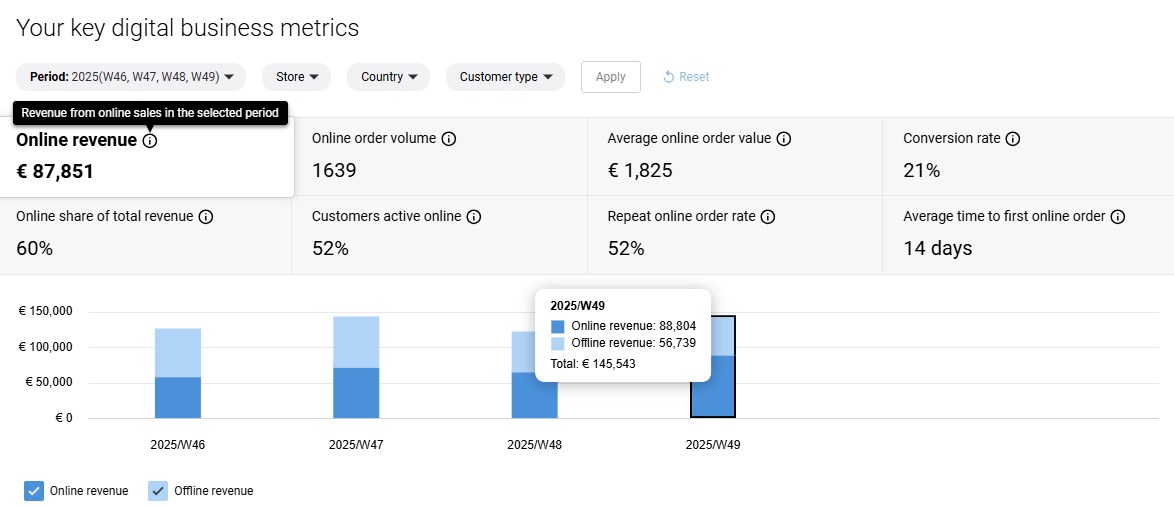
The Key digital business metrics widget is your central hub for monitoring the performance and growth of your online business. It displays essential metrics that help you understand how your Sana webstore is performing and contributing to your overall business success, and where improvements or follow-up actions might be needed.
Filters
Each metric is calculated based on the filters you select:
- Period: Year > quarter > month > week.
- Store: Individual webstore or multiple webstores.
- Country: Based on one specific country or several countries.
- Customer type: B2B or B2C.
When a filter has more than nine available options, a Search bar is displayed to make it easier to find what you need.
Filters are applied only after you click the Apply button. Clicking the Reset button will return all selected filters to their default values.
Online vs. Offline Sales Data
Where applicable, online sales data is compared with offline sales data. You can view both online and offline data side by side to see the complete picture or hide one channel if you want to focus exclusively on the other.
- Online data: Refers to everything created through the Sana webstore.
- Offline data: Refers to sales data created through other channels, such as orders placed directly in your ERP system via phone or e-mail, for example.
This comparison helps e-commerce managers understand how your Sana webstore performs relative to traditional offline sales channels and identify growth opportunities.
Using the Widget
Each metric includes an information icon that provides additional details about what the metric measures and how it is calculated.
Charts offer deeper insight, and hovering over them reveals exact values for specific dates or periods.
Available Metrics
-
Online revenue: The total revenue generated from online sales through your Sana webstore.
-
Online order volume: The total number of orders placed online through your Sana webstore.
-
Average online order value: This metric shows the average amount customers spend per order. Calculated by dividing online revenue by the number of online orders.
-
Conversion rate: The percentage of customers who placed an online order after logging into their account. This helps you understand how effectively your webstore turns visitors into buyers.
-
Online share of total revenue: Shows your online revenue as a percentage of total revenue (including offline channels), helping you understand your digital channel's contribution to overall business.
-
Customers active online: The percentage of customers with shop accounts who logged in to your Sana webstore during the selected period. This metric indicates customer engagement with your webstore.
-
Repeat online order rate: The percentage of customers with shop accounts who placed more than one online order during the selected period. This reveals customer loyalty and satisfaction.
-
Average time to first online order: The average number of days between a customer's account creation and their first online order. This helps you understand how quickly new customers are converting.
For more information, see Performance & Growth.