Sana Commerce Insights 1.16.0
Release date: December 16, 2022
Learn about new features, improvements, and bug fixes in this release.
What’s New?
Benchmarks
Benchmarks allow you to evaluate the performance of your webstore compared to other Sana customers. It is an innovative approach to using data that provides extremely valuable insights and guides you on the journey of improving your e-commerce performance.
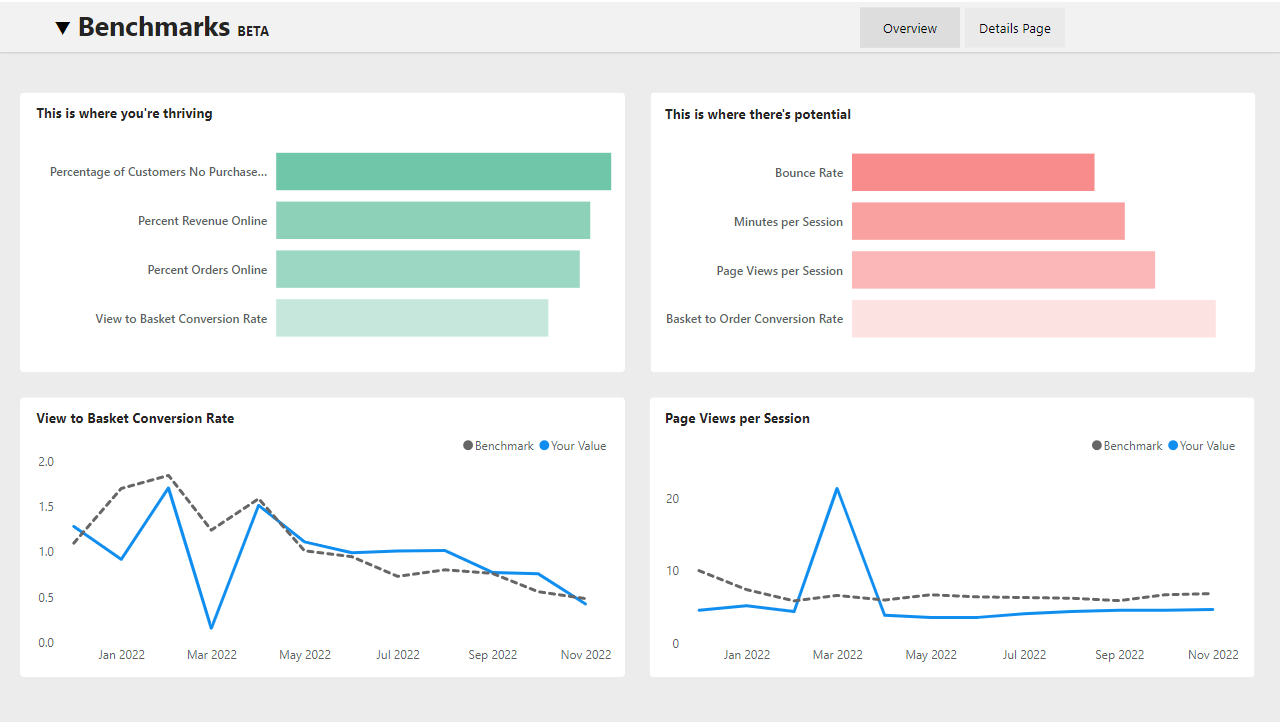
The Benchmarks page consists of two parts – Overview and Details Page. The Overview page offers you four metrics where your company is performing well and four metrics where your company has room to grow. They are generated based on the data for the last calendar month.
After clicking on the metric, the graph below will show the evolution of your value and the benchmark value over time. All data is measured at monthly intervals.
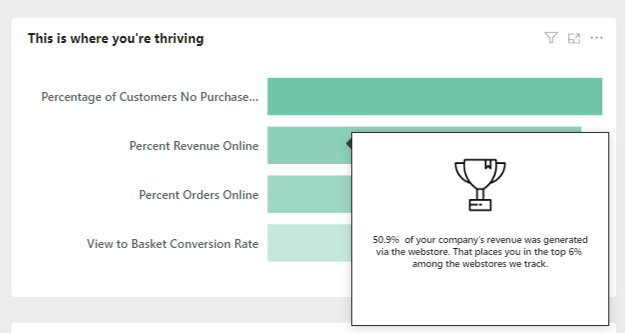
Hover over any bar to see the metric definition and your rating compared to other customers.
On the Details Page, you will find information about each of the 18 metrics for which Sana Commerce Insights calculates benchmarks. You can see how big the difference between your value and the benchmarks value is. All data in the table on the left is for the last calendar month.
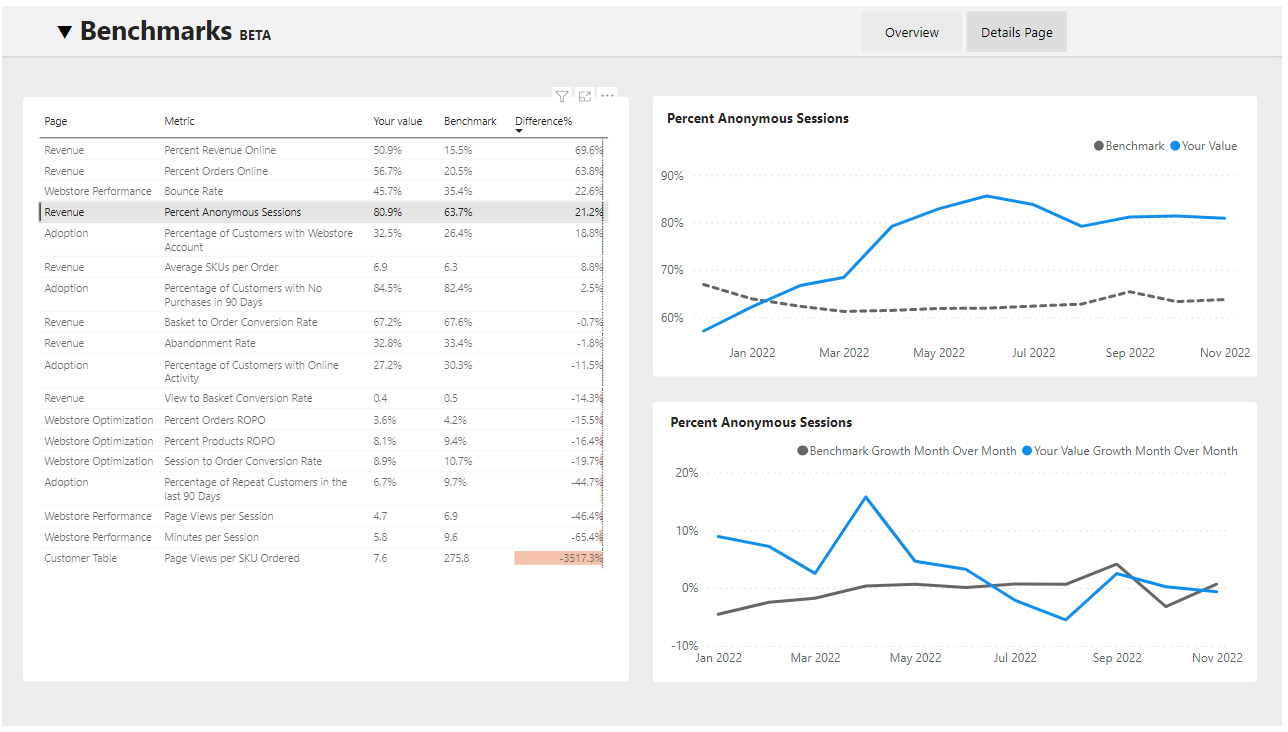
After clicking on any row in the table, the graphs on the right adjust to show the evolution of the metric and benchmarks over time, as well as changes in their growth rate over the month.
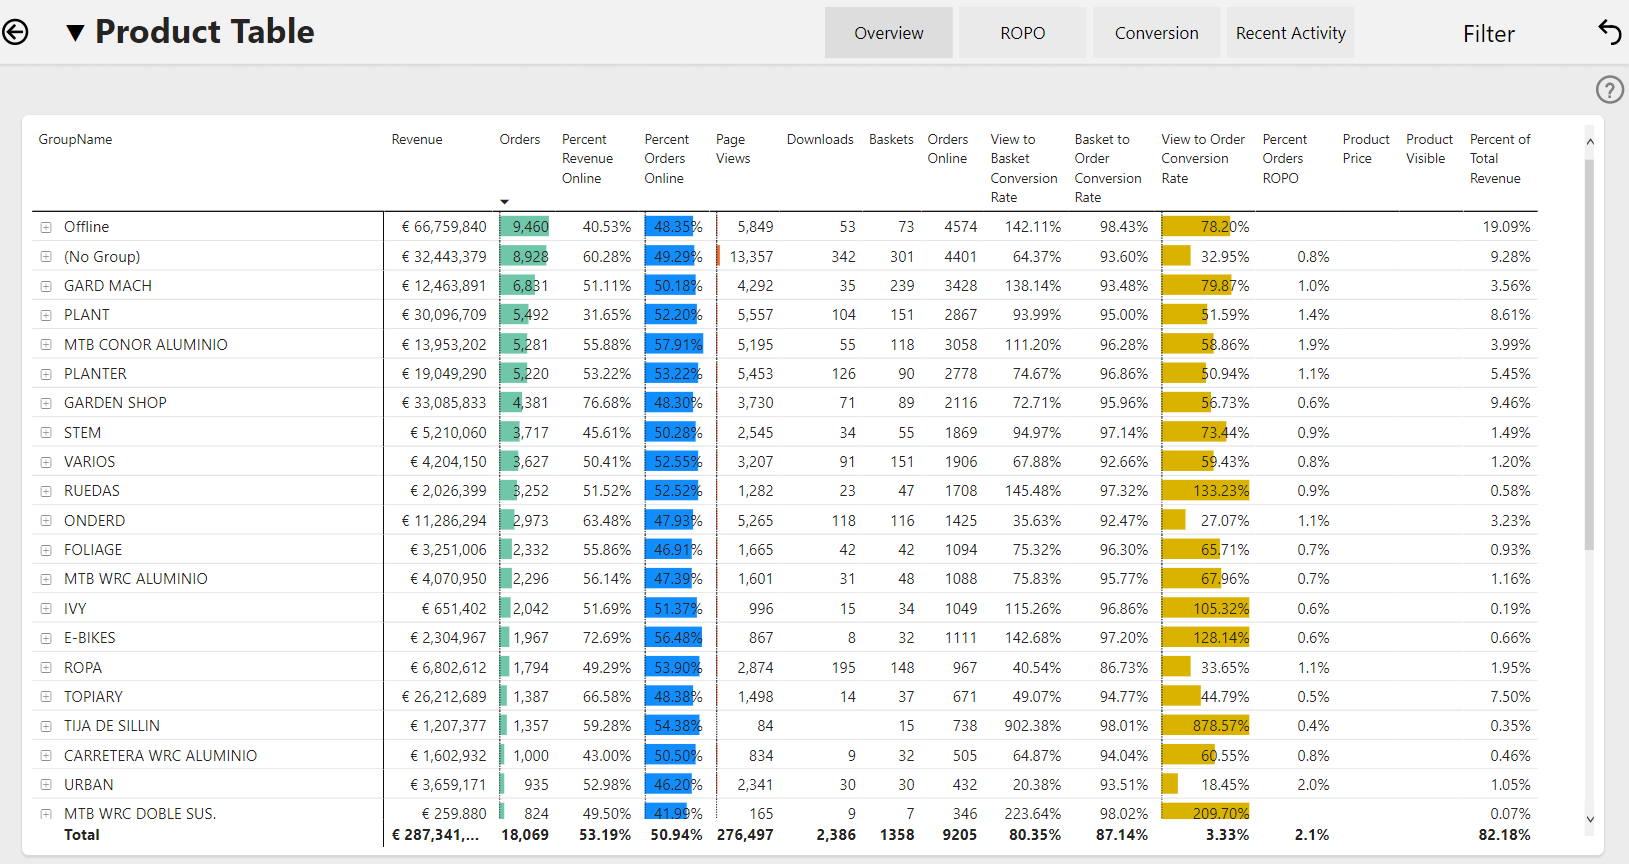
Page Navigation
To navigate through the different visual objects on the same page, click on the relevant button on the navigation bar at the top of the page.