Benchmarks
What Are Benchmarks and Why Sana Offers Them
Have you ever looked at a metric, for example, “Bounce Rate for October equals 32.60%”, and wondered how best to assess whether you should be happy with this number? Or perhaps you have wondered which of your webstore KPIs deserve the most attention and should be worked on?
Benchmarks is a feature of Sana Commerce Insights that can help you with these questions. Essentially, benchmarks do two things:
-
Your webstore is ranked against other Sana customers on 16 different KPIs. Sana Commerce Insights will tell you in which KPIs your performance is the strongest and in which it is the weakest, compared to other businesses.
-
A benchmark value is calculated for each KPI. The benchmark value is simply the average value for all customers for which data is available.
The purpose of benchmarks is to assist you to identify areas for further growth of your online business to continuously make it more successful. This can be extremely helpful when setting goals for the Sana Success Track with your Customer Success Manager.
Furthermore, the unique data on the performance of other webstores will give you a new perspective on your own performance. For example, when you notice a drop in a KPI you are tracking, let’s say the Basket to Order Conversion Rate has dropped from 75% to 70%, you might want to know if the benchmark is showing a similar trend or if your business seems to be the outlier. Alternatively, you can conclude that the drop is less alarming, knowing that you are still well above the average for this metric. Both are undoubtedly valuable insights.
How Benchmarks Are Calculated
Sana Commerce Insights considers 16 metrics such as Bounce Rate and Percent Orders Online which are comparable for all webstores. SCI calculates an average value for all customers with available data to obtain the benchmark.
Benchmarks data has a monthly frequency and each time after the end of the month you will see fresh data.
Your webstore must be live for at least a full calendar month before you see your data on the Benchmarks page. For example, if you went live on January 15, you will see your benchmark data on March 1, after processing data for your first full calendar month (February). Before that, you will see only benchmarks based on other customers’ data.
Benchmarks are calculated per webstore. This means that customers who have a multi-store solution can see benchmark ranks for each webstore separately. It is very likely that your B2B store performs differently than your B2C store, for example, that is why this information might be useful for you.
If you have several Sana webstores, use the Filter menu on the Benchmarks page to choose the webstore you need.
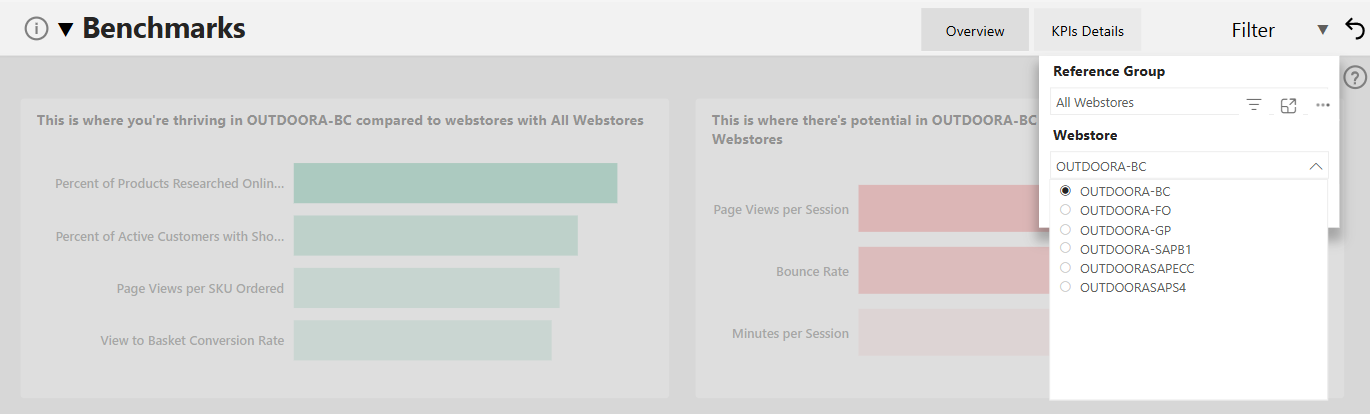
Benchmarks can also be filtered per reference group. This means that you can specify a subset of webstores and only those will be used when calculating the rank of your webstore on each KPI. We ensured that each reference group is big enough to allow for statistically robust comparisons.
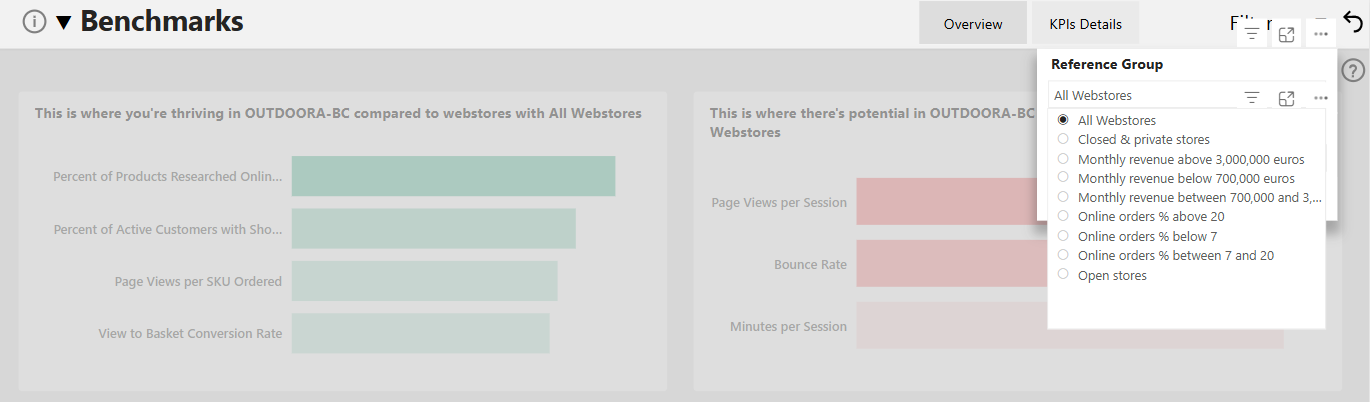
On top of that, you can also compare your webstore to all webstores with available data.
The ranks on the Benchmark page will be recalculated considering the selected filter. You can see the reference group the metrics are related to at the top of the graph.
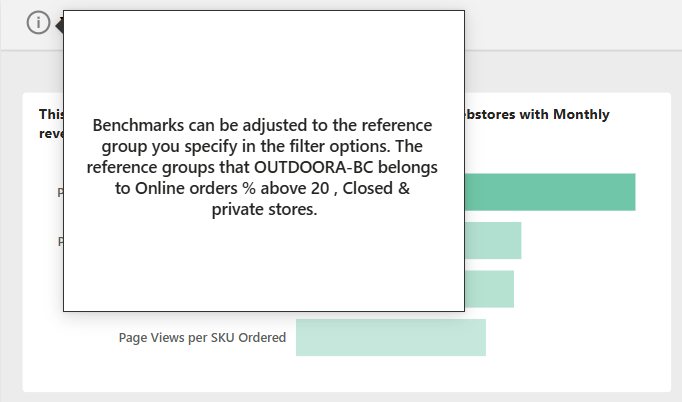
If you need to check which reference groups your webstore belongs to, hover over the tooltip in the top right corner of the page.
How SCI Determines the Metrics Where You Excel and Where You Have the Potential to Improve
For each of the 16 available metrics, all webstores are ranked against each other. This is done based on data from the last calendar month. For example, as of December 16, 2024, the last calendar month is November 2024.
The SCI then chooses 4 metrics for which your relative ranking is highest and displays them under the This is where you’re thriving section. Similarly, three metrics for which you have a relatively low score will appear in the This is where there’s potential section.
With this design, each customer always sees their four best and three worst metrics. Even if, for example, your webstore is already exceptional and your worst relative ranking is in the bottom 75% (in other words, in the top 25%), SCI will suggest areas for further growth.
Some metrics are considered "good" when their values are high, for example, Percent Revenue Online or Percentage of Active Customers. Other metrics are considered "good" if their values are as low as possible, for example, Abandonment Rate. Keep in mind that SCI assumes that for Percent of Products Researched Online Purchased Offline and Percent of Orders Researched Online Purchased Offline the desired value is as low as possible.
Example of Benchmarks Interpretation
Let’s look at the benchmarks dashboard below and interpret the information presented.
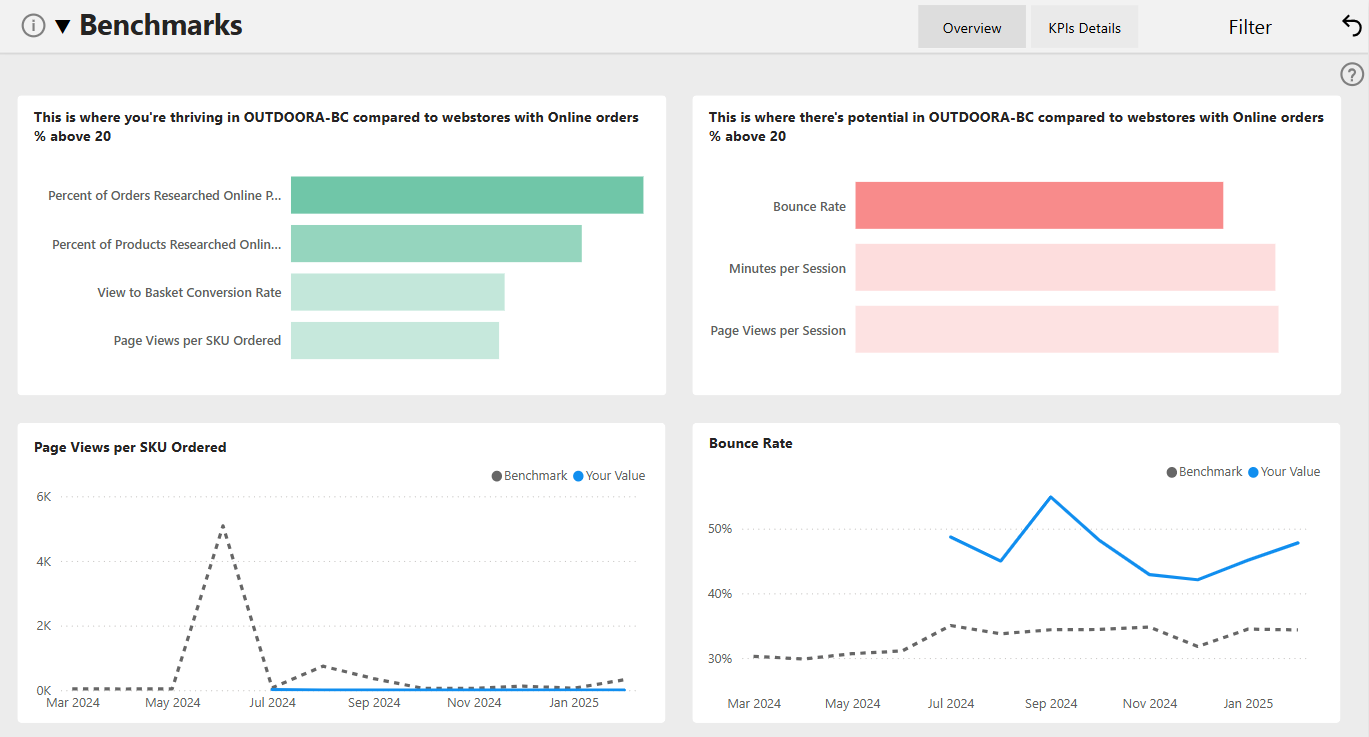
The first insight is that the webstore is performing best on the following metrics: Percent of Orders Researched Online Purchased Offline, Percent of Products Researched Online Purchased Offline, View to Basket Conversion Rate, and Page Views per SKU Ordered. This is relative to other webstores and calculated based on data for January 2025 - the last month with data as you can see on the x-axis of the bottom graphs.
Hovering over the green or red bar, you will see more details.
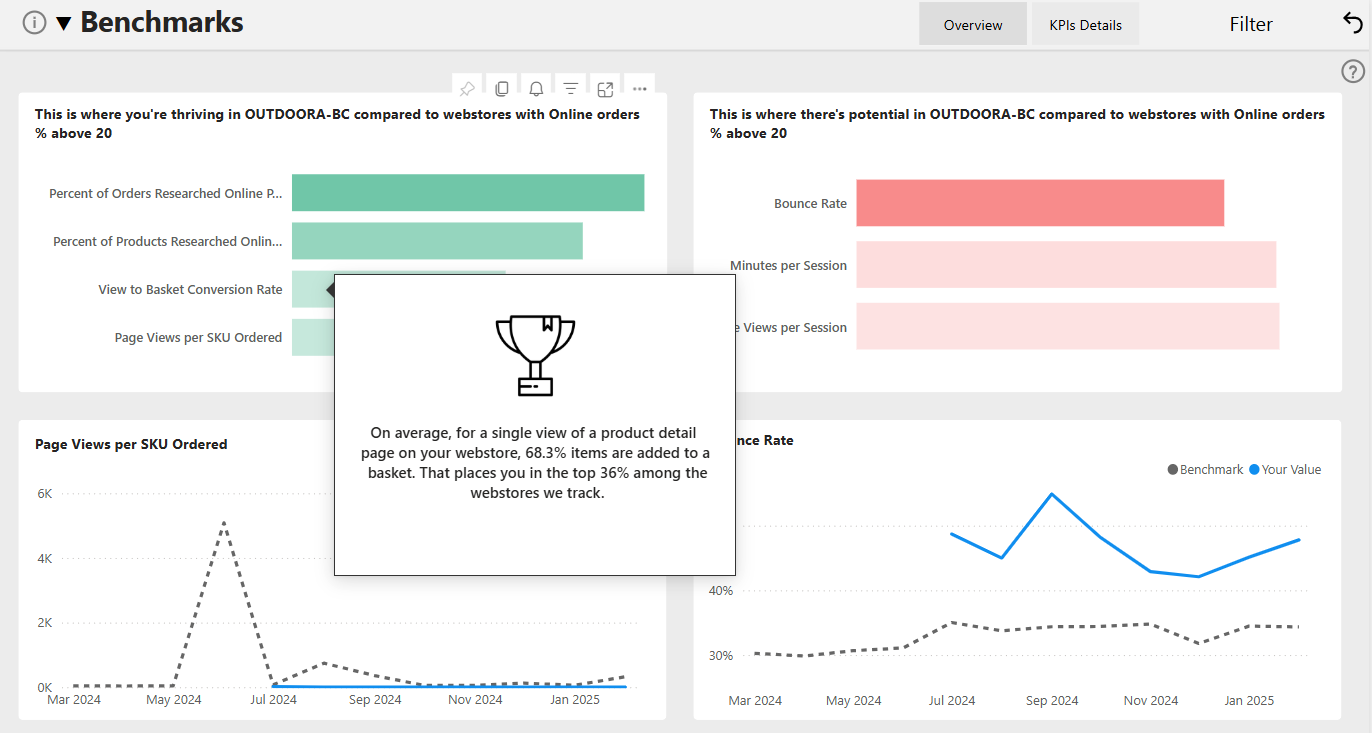
Moreover, after clicking on any of the bars, on the graph below you will see the evolution of this KPI over time, both for your webstore and the benchmark value.

For items under This is where there is potential, the mechanism is the same. Importantly, these metrics can suggest the direction of changes that should be made to your webstore to make it more successful.
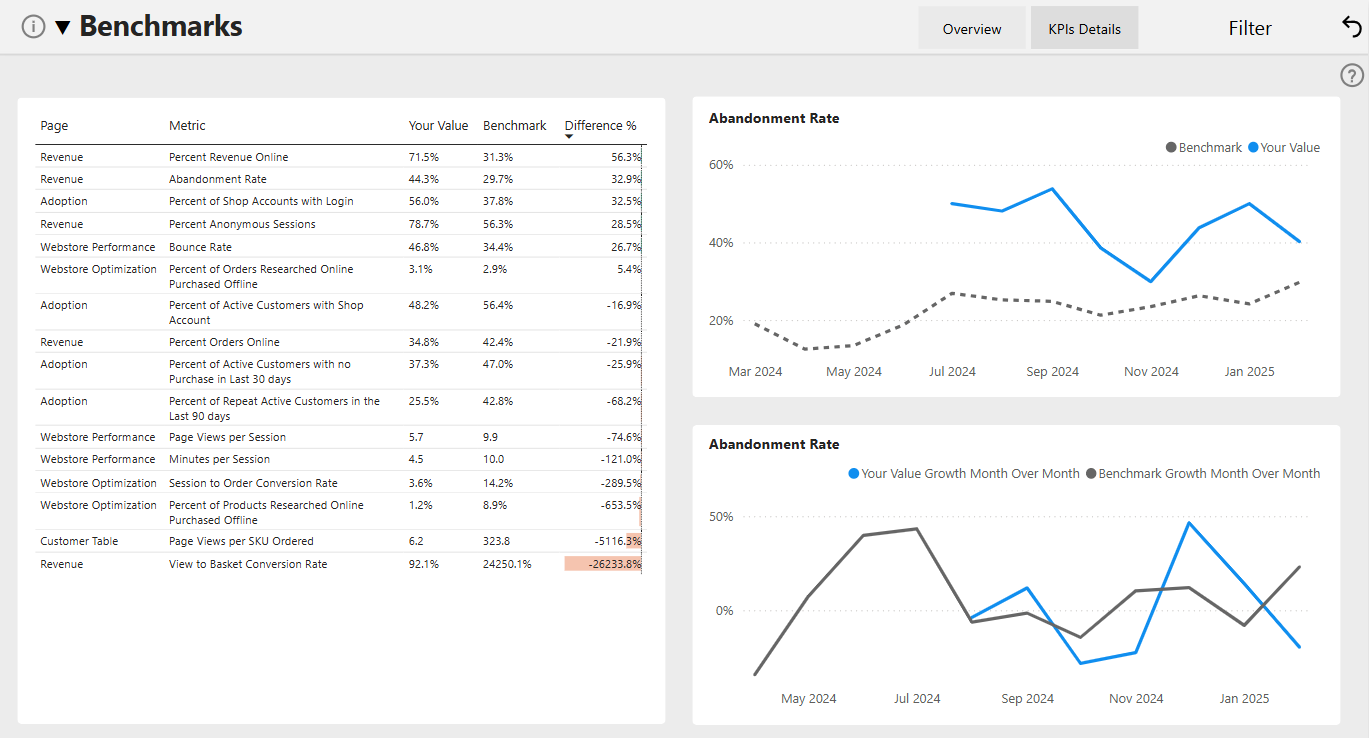
If you want a more in-depth look at all the metrics SCI uses for benchmarks, the KPIs Details will be helpful. The data presented there is for all benchmarks. The values you see in the table are calculated for the past calendar month and the table is sorted by the percentage difference between the benchmark and your webstore’s value. Clicking on any row in the table affects the graphs on the right side of the page – this way you can explore historical trends across all KPIs.
Frequently Asked Questions
How often does data on the benchmarks page refresh?
Benchmarks are refreshed monthly. Fresh data is processed on the first day of the month. Each time this happens, you can see different KPIs where you are thriving and where there is potential, as they are identified based on data from the last calendar month.
I have several webstores, can I see the rating for just one webstore?
Yes, the benchmark data is calculated for each webstore.
What businesses is my webstore compared to?
You are compared based on the selected reference group. This is a group of webstores based on specific criteria used to calculate the rank of your webstore on each KPI, for example, private or open webstores, based on monthly revenue that is above or below a specific amount, etc.
Since Sana uses my business data to compare with other customers, is my data safe?
Your data is aggregated and anonymized before being used in the report. Benchmarks do not create a risk of data leakage.
My webstore recently went live and the benchmarks page doesn’t show the information I expect. Why is this the case?
Your benchmarks will appear on the first day after the first full calendar month after your go-live. The KPI values for your webstore needed to calculate benchmarks are only processed monthly for full months to ensure that your data is comparable with other customers.
If you still experience this issue more than 2 months after the go-live, please contact the Sana Commerce support or your Sana representative.