Performance Profiler
WATCH THE VIDEO
Sana's performance profiler uses the ASP.NET mini-profiler, which is a simple, but effective tool that can be used by technical people and developers to solve performance issues.
To run the performance profiler, in Sana Admin click: Tools > Performance profiler. The webstore will open with a Profiler bar at the top left corner.
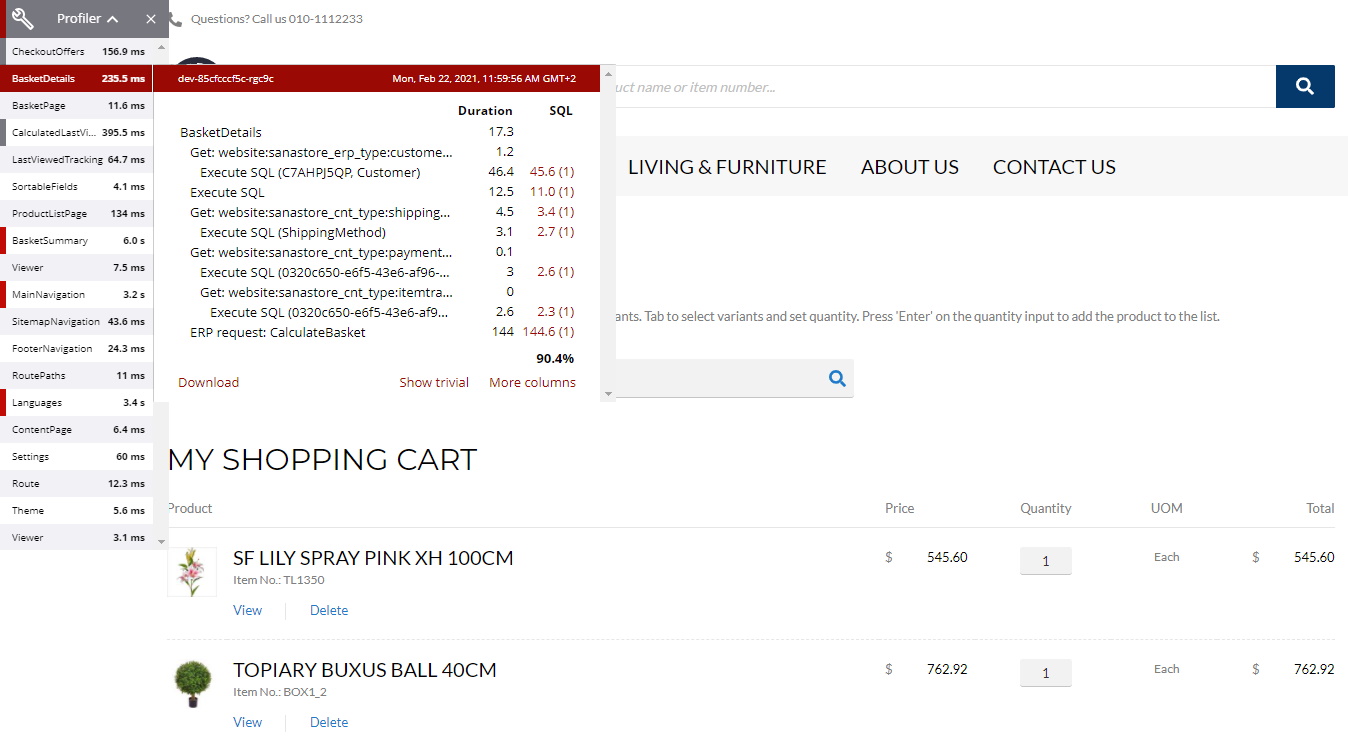
Developers can use the profiler to check all Web service (ERP requests and responses), and other API calls that are executed on the webstore pages. For example, developers can see how long it took to execute a certain request, from the time the request started till the end of the request.
- All API calls with the ERP requests are highlighted in gray.
- All API calls with slow performance are highlighted in red.
Using performance profiler, a webstore administrator can download ERP requests and responses, and any API call that is executed on a webstore page. This data is saved as an HTML page with all links clickable. If there are any issues, webstore administrators can share this data with their technical department or a support representative of Sana for further investigation.