Webstore Optimization
The Webstore Optimization page brings together key metrics to help you understand where customers might be dropping off in the buying journey and what actions you can take to improve your webstore performance. From click behavior to conversion rates, this dashboard gives you the insight needed to remove friction and drive more orders.
By analyzing behavior across sessions, baskets, and purchases (both online and offline), you can spot usability gaps, improve product visibility, and increase order completion rates.
It’s your go-to view for diagnosing the conversion funnel, spotting weak points in the buyer journey, and guiding optimization efforts to improve sales outcomes.
How KPIs Are Defined
-
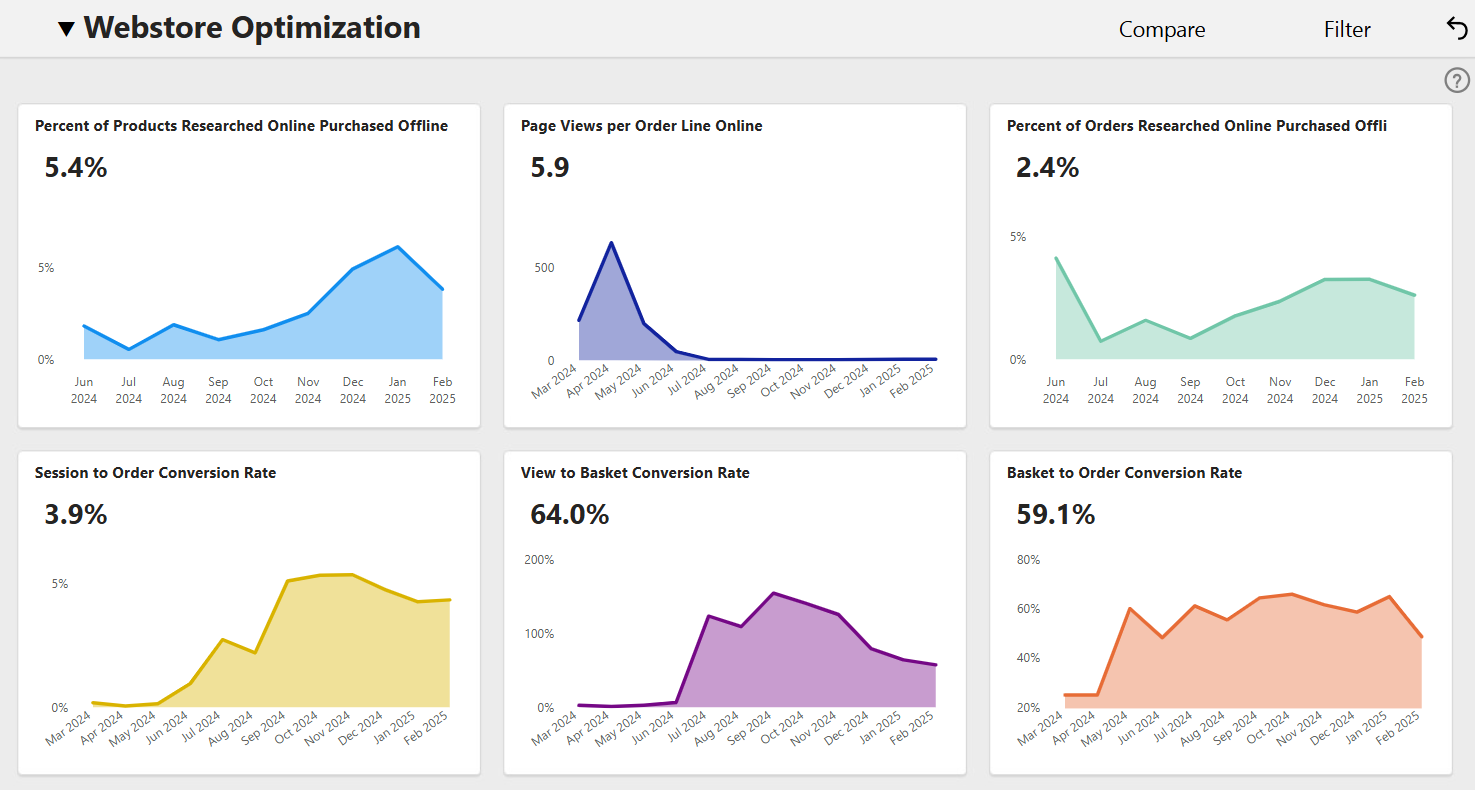
Percent of Products Researched Online Purchased Offline: % of products that were viewed online and later bought offline. Based on a product page view by a logged-in customer, followed by an offline order within 30 days.
-
Page Views per Order Line Online: Average number of webstore page views per online order line. Includes all page types, not just product pages.
-
Percent of Orders Researched Online Purchased Offline: % of offline orders that contain at least one product viewed online beforehand. Shows how often online research drives offline conversion.
-
Session to Order Conversion Rate: % of webstore sessions that result in an online order. Helps you assess how effective each visit is at generating sales.
-
View to Basket Conversion Rate: % of product page views that result in a product being added to a basket. Can exceed 100% in B2B scenarios due to reordering behavior bypassing product pages.
-
Basket to Order Conversion Rate: % of baskets (open + completed) that turn into online orders. A high rate indicates efficient checkout and buyer commitment.