Traffic Analytics
The Traffic Analytics dashboard gives you a comprehensive view of how users interact with your Sana webstore. With three focused tabs - Overview, Session Details, and Searches - you can analyze user behavior, identify engagement patterns, and uncover areas for optimization across your webstore.
By leveraging this data, you can:
- Improve the shopping experience.
- Optimize your webstore content and layout.
- Strengthen your SEO and product discovery.
- Increase conversions by removing friction from the customer journey.
- Identify surges in product popularity, or searches for products you don’t yet carry, to make proactive inventory and smarter product offering decisions.
Overview
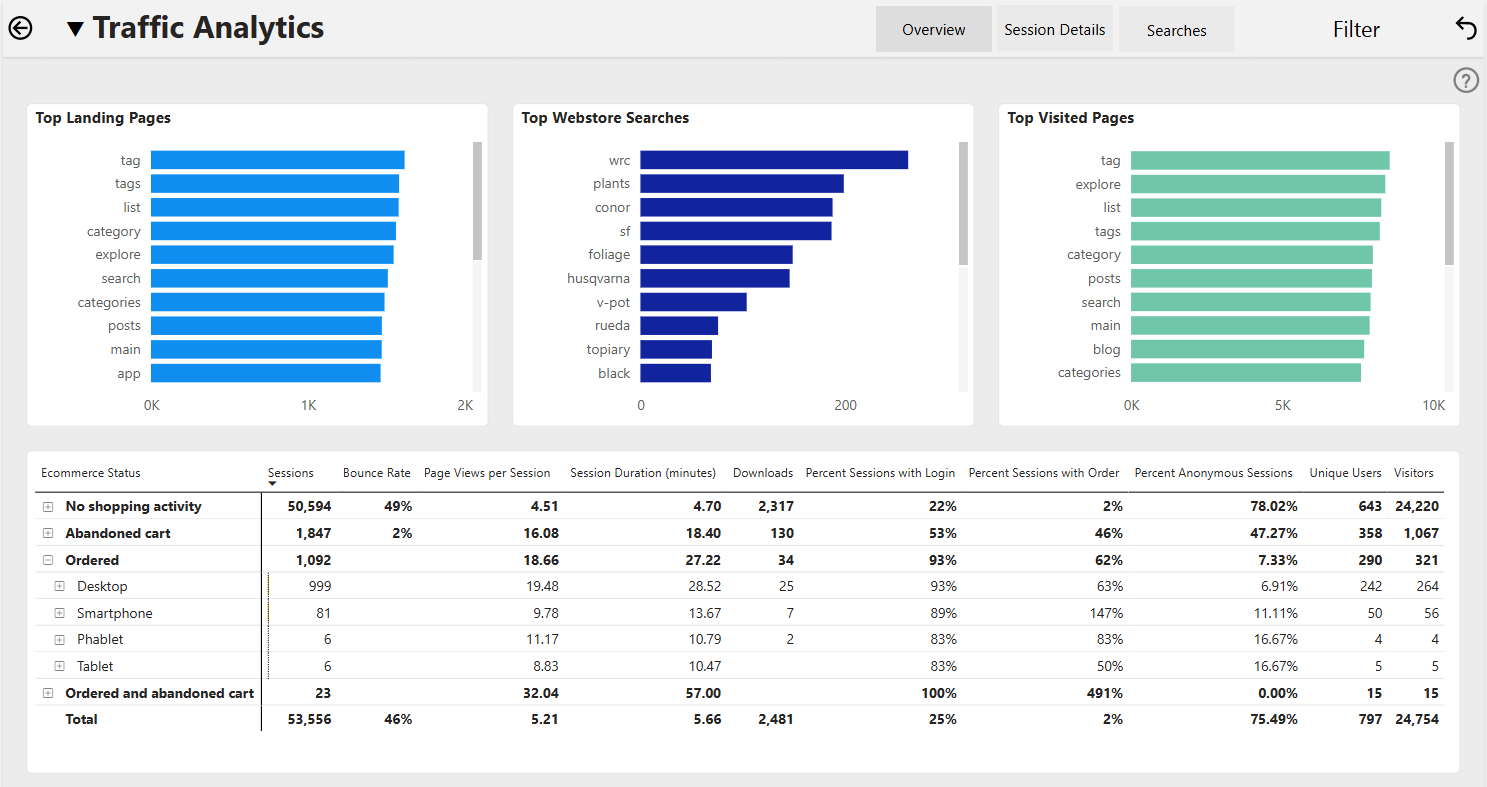
The Overview tab offers a high-level summary of webstore traffic and user behavior. It includes charts for top landing pages, most visited pages, and popular search terms, plus engagement metrics like bounce rate, page views, session duration, and conversion activity by device type or user segment.
It’s your go-to view for monitoring webstore health at a glance, giving you quick answers to questions like: Where are users landing? How long are they staying? Are they converting?
How KPIs Are Defined
-
Top Landing Pages: Most common entry points to your webstore.
-
Top Webstore Searches: Most frequently searched terms.
-
Top Visited Pages: Pages with the highest traffic overall.
-
Sessions: Total number of sessions across the webstore.
-
Bounce Rate: % of sessions with only one page view.
-
Page Views per Session: Average number of pages viewed in a session.
-
Session Duration: Average time users spend during a session.
-
Downloads: Number of files or product documents downloaded.
-
Percent Sessions with Login: % of sessions tied to a logged-in user.
-
Percent Sessions with Order: % of sessions where an order was placed.
-
Percent Anonymous Sessions: % of sessions by visitors who didn’t log in.
-
Unique Users: Count of individual users.
-
Visitors: Total visits (including repeat visitors).
Session Details
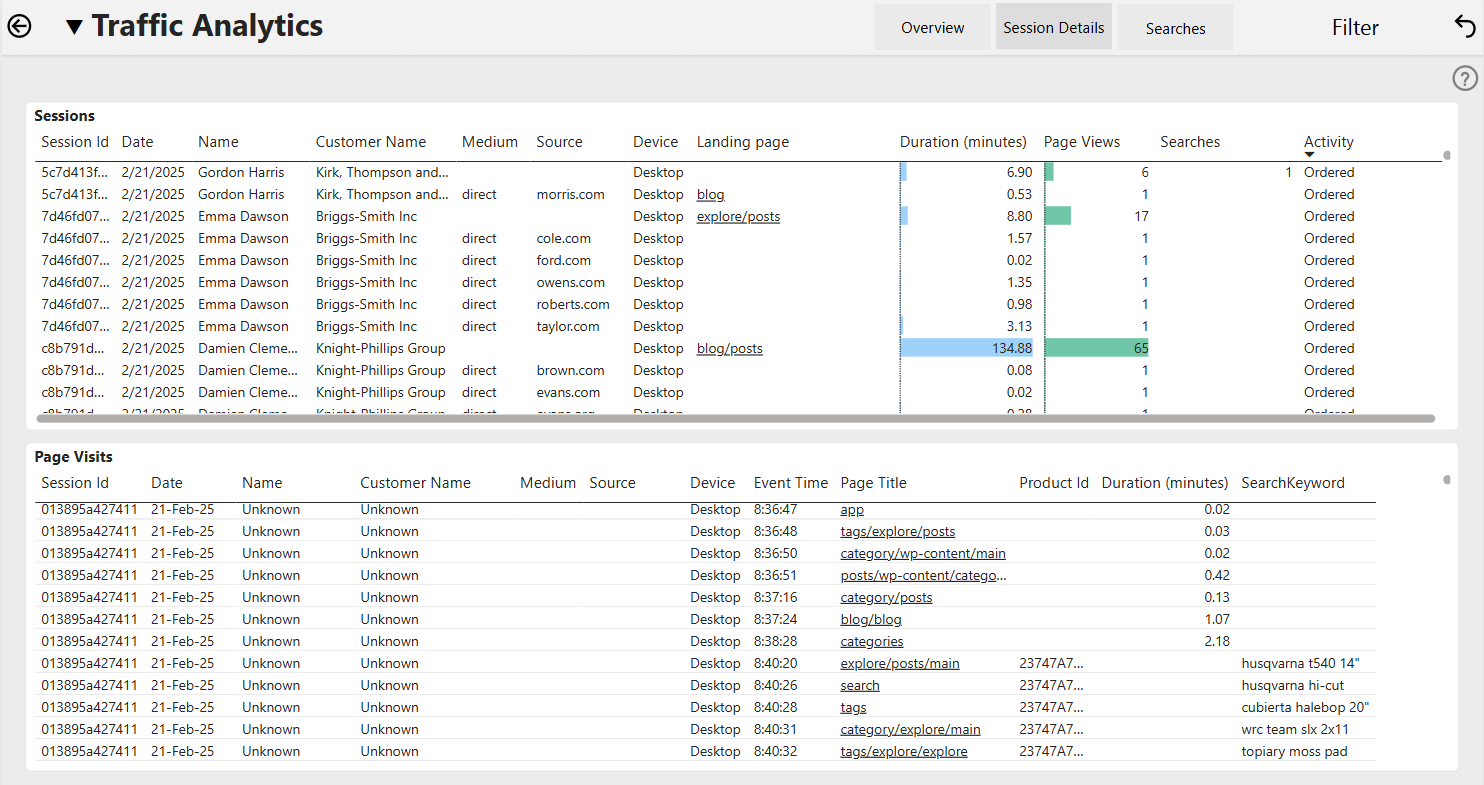
The Session Details tab gives you a deep dive into individual session data.
You can track:
- Specific sessions by customer or anonymous user.
- Referring source, device, and landing page.
- Session length, page views, searches, and activity (like ordering).
- Only the last 30 days of sessions are included on this page.
This granular view helps you understand how real users navigate your webstore - and where they succeed or struggle.
It’s your go-to view for diagnosing friction in the customer journey, understanding behavior on a session-by-session level, and improving site structure or checkout flows based on real usage.
Searches
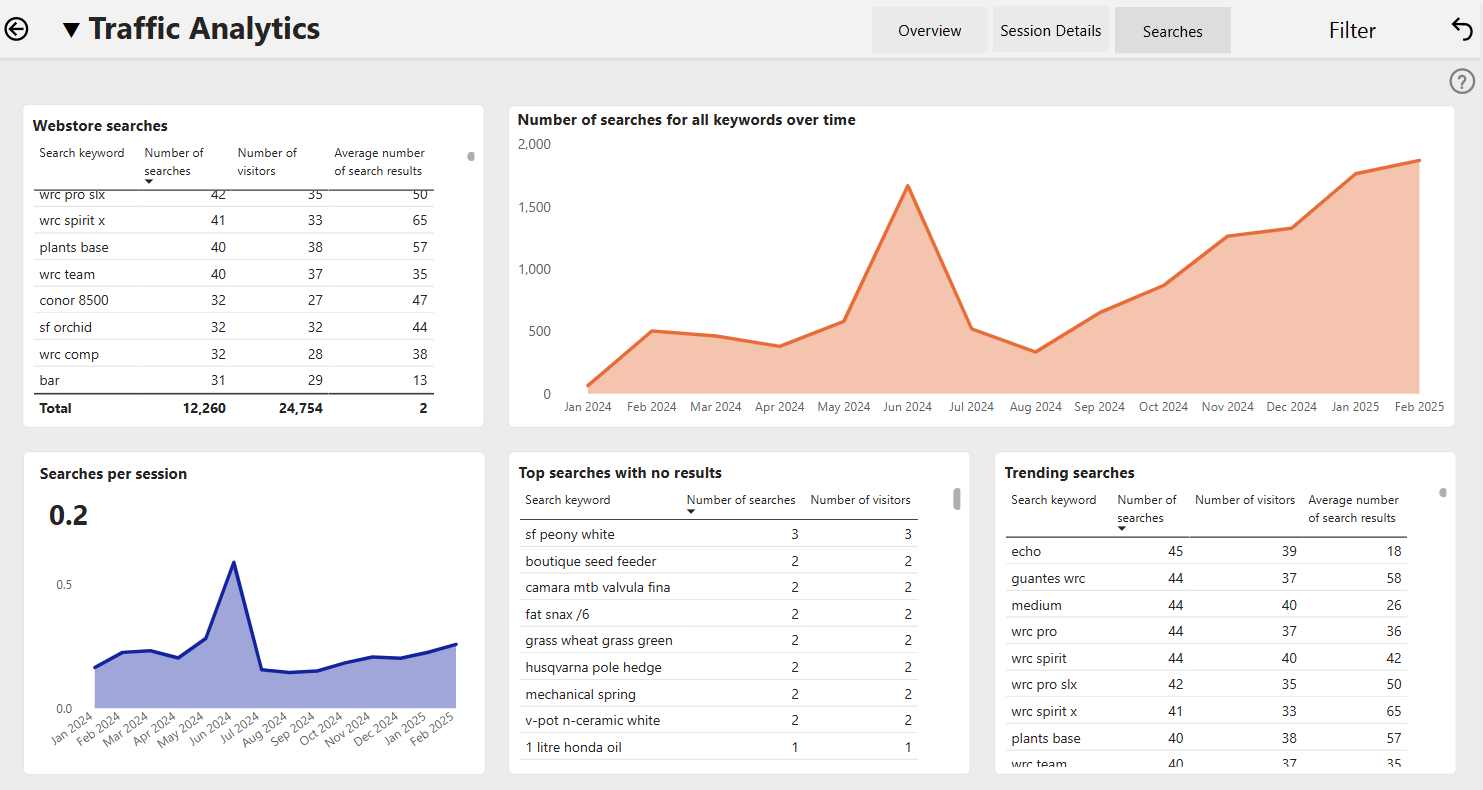
The Searches tab reveals how customers use your store’s internal search engine - and whether they find what they’re looking for.
You can explore:
- The most searched keywords.
- Trending and seasonal search patterns.
- Searches per session.
- Terms that return no results.
- Average number of results per search.
This helps you fine-tune search settings, improve product tagging, and fill inventory gaps based on customer intent.
It’s your go-to view for improving product discoverability, enhancing search UX, and spotting unmet demand that could signal new product opportunities.