Revenue
The Revenue dashboard helps you evaluate how your webstore contributes to your overall business performance. By combining ERP data with online behavior insights, this page reveals how much you're selling online compared to offline channels.
With key KPIs like online revenue share, average order value, and order line breakdowns, you can quickly assess:
- How well your webstore is functioning as a sales engine.
- Where digital buying behavior is increasing or declining.
- How online engagement translates into actual commercial results.
These insights support decisions around pricing, product strategy, and digital adoption, helping you grow revenue across all channels while staying competitive in the B2B market.
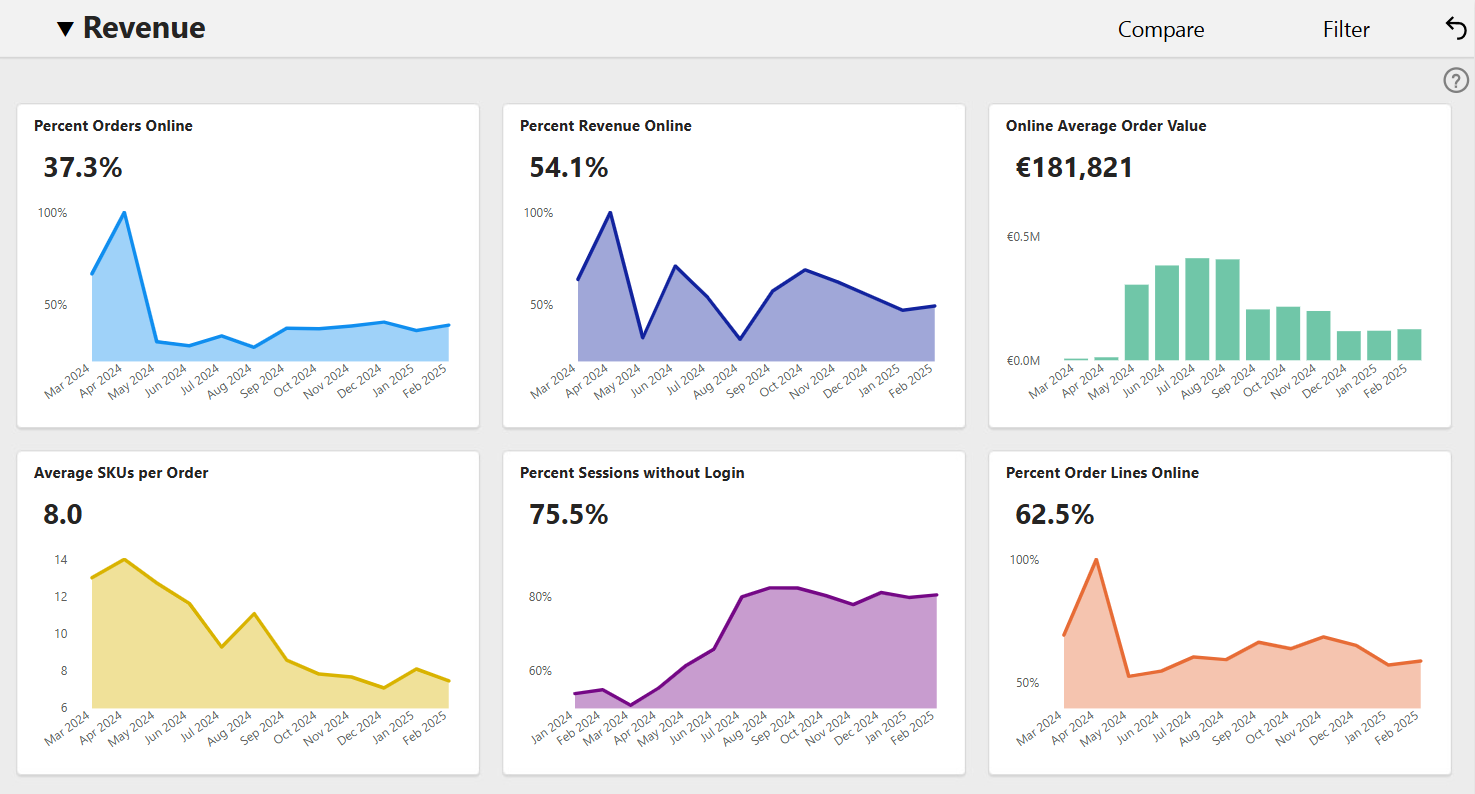
How KPI Are Defined
-
Percent Orders Online: The number of orders placed online divided by your total number of orders.
-
Percent Revenue Online: The sum of all the online revenue divided by your total revenue.
-
Online Average Order Value: The average revenue per order for orders placed online.
-
Average SKUs per Order: The average number of unique products per order. This includes both online and offline orders.
-
Percent Sessions without Login: The number of anonymous sessions divided by the number of sessions. An anonymous session is when someone visits your webstore without logging in. Notice that with most compare dimensions, this metric will return a blank value. That is because anonymous sessions cannot be attributed to, for example, different customer groups from your ERP because the visitors are not logged in.
-
Percent Order Lines Online: Shows how much of your total product sales are happening through your Sana webstore. It measures the percentage of products sold online through your Sana webstore compared to all products sold, whether online or offline. It helps you understand how much effort is saved by processing orders online.