Product Table
The Product Table is a powerful analytics tool that gives you a detailed, data-driven view of how products perform throughout the entire buying journey - from discovery to purchase.
Divided into four tabs - Overview, ROPO, Conversions, and Recent Activity - this dashboard brings together online behavior, offline orders, and engagement metrics to help you:
- Optimize product visibility and placement.
- Improve conversion rates.
- Align product strategy across sales channels.
More than just a report, the Product Table helps you to connect browsing behavior to ERP-backed sales data. It enables smarter decisions on content, assortment, and follow-up - all based on real customer interactions both online and offline.
Overview
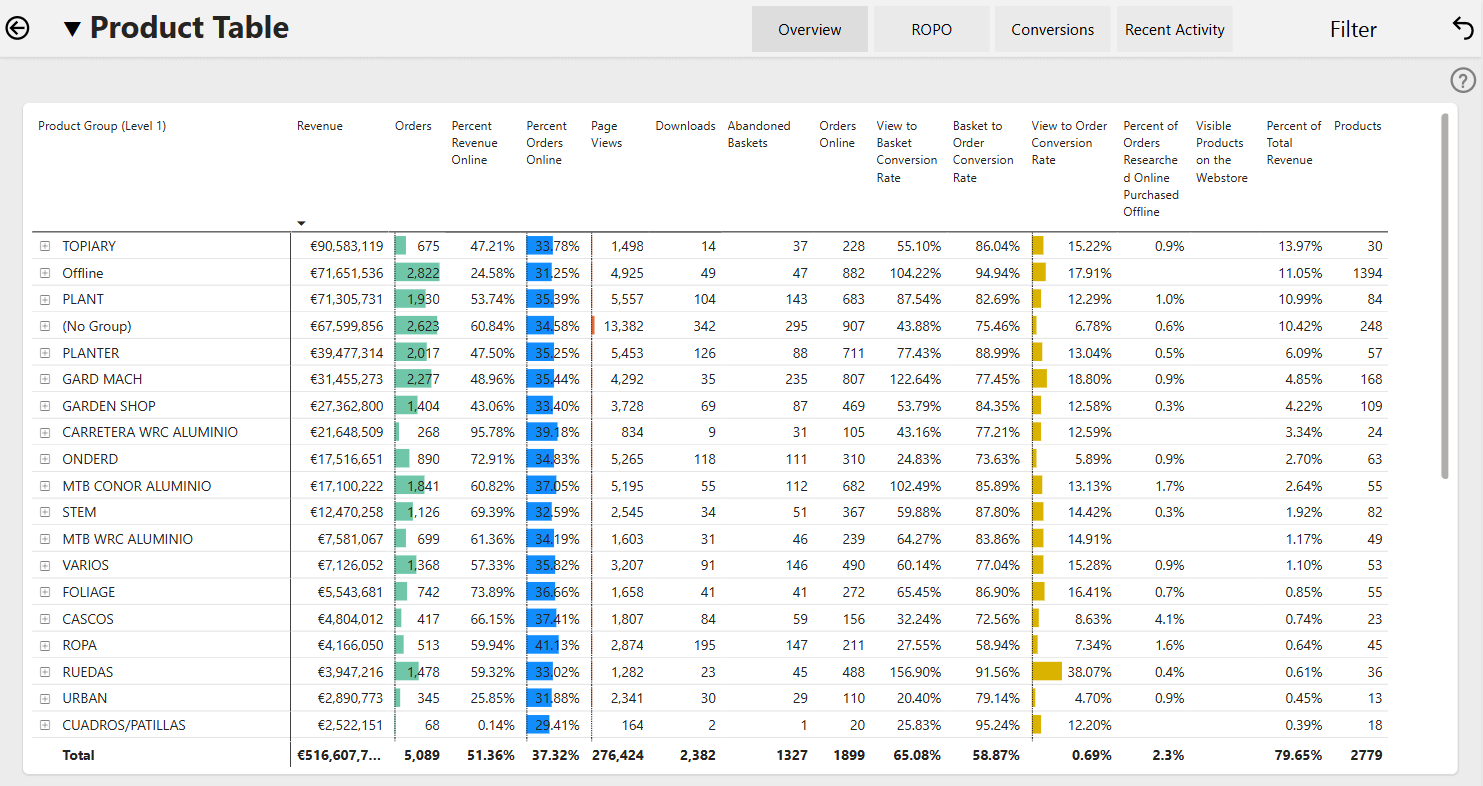
The Overview tab combines product visibility, engagement, and sales performance metrics in one place.
Use this view to:
- Identify high-traffic, low-converting products.
- Spot missed opportunities (e.g. views with no orders).
- Prioritize content improvements or promotional efforts.
- Track online vs. offline sales contribution per product.
It’s your go-to view for answering: What products are driving performance, and where is there potential to improve?
How KPIs Are Defined
-
Revenue: The sum of revenue per order line including taxes.
-
Orders: The number of orders.
-
Percent Revenue Online: The sum of all online revenue divided by all revenue.
-
Product Detail Views: The number of product details page views.
-
Downloads: The number of downloads.
-
Abandoned Baskets: The number of baskets.
-
Orders Online: The number of orders placed online.
-
View to Basket Conversion Rate: The number of baskets (open and closed) divided by the number of page views.
-
Basket to Order Conversion Rate: The number of online orders divided by the number of baskets (open and closed).
-
View to Order Conversion Rate: The number of orders divided by the number of page views.
-
Percent of Orders Researched Online Purchased Offline: The number of orders that were viewed online but placed offline divided by all orders.
-
Visible Products on the Webstore: By expanding the product group, you can see which products within it are visible or hidden on the webstore.
ROPO (Researched Online, Purchased Offline)
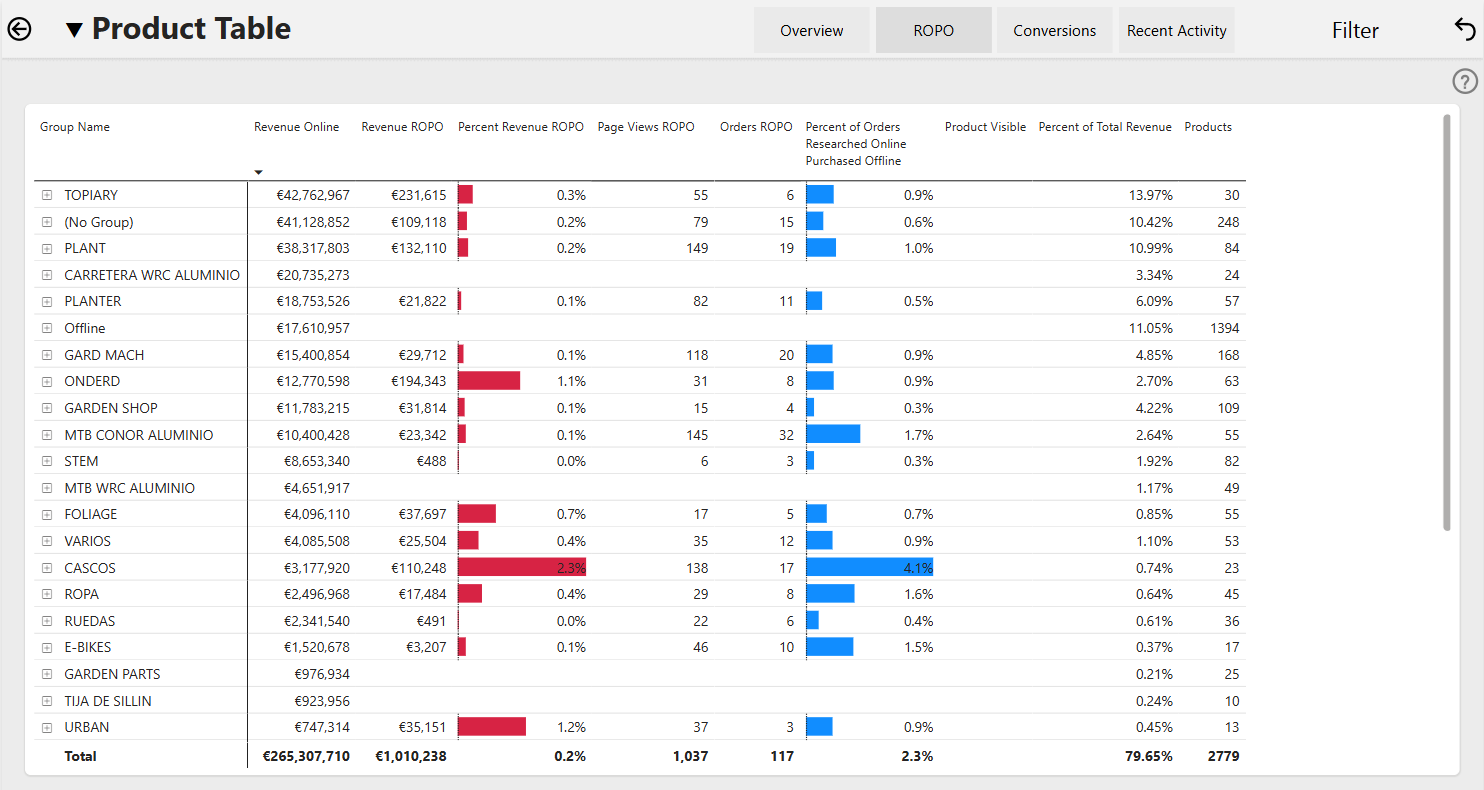
The ROPO table helps e-commerce teams uncover the hidden impact of their webstore by showing how often customers research products online but complete the purchase offline. This insight reveals the true influence of your digital presence, even when the transaction happens elsewhere.
A product is classified as ROPO when a logged-in customer views its product details page and then places an offline order for that product within 30 days.
This table helps identify:
- Products that drive offline sales through online visibility.
- Opportunities to improve product information and conversion paths.
- Customer behaviors that blend online research with offline buying.
It’s your go-to view for understanding which products could be sold more online by for example improving product information and conversion, or for understanding how your webstore supports the offline sales engine, helping you prove the value of online engagement beyond digital transactions.
How KPIs Are Defined
-
Revenue Online: The sum of all online revenue.
-
Revenue ROPO: The sum of all revenue that was viewed online but bought offline.
-
Percent Revenue ROPO: The sum of all revenue that was viewed online but bought offline divided by the sum of all revenue.
-
Product Detail Views ROPO: The number of online product details page views and offline purchases.
-
Orders ROPO: The number of orders that were viewed online but placed offline.
-
Percent of Orders Researched Online Purchased Offline: The number of orders that were viewed online but placed offline divided by the total number of orders.
-
Product Visible: By expanding the product group, you can see which products within it are visible or hidden on the webstore.
Conversions
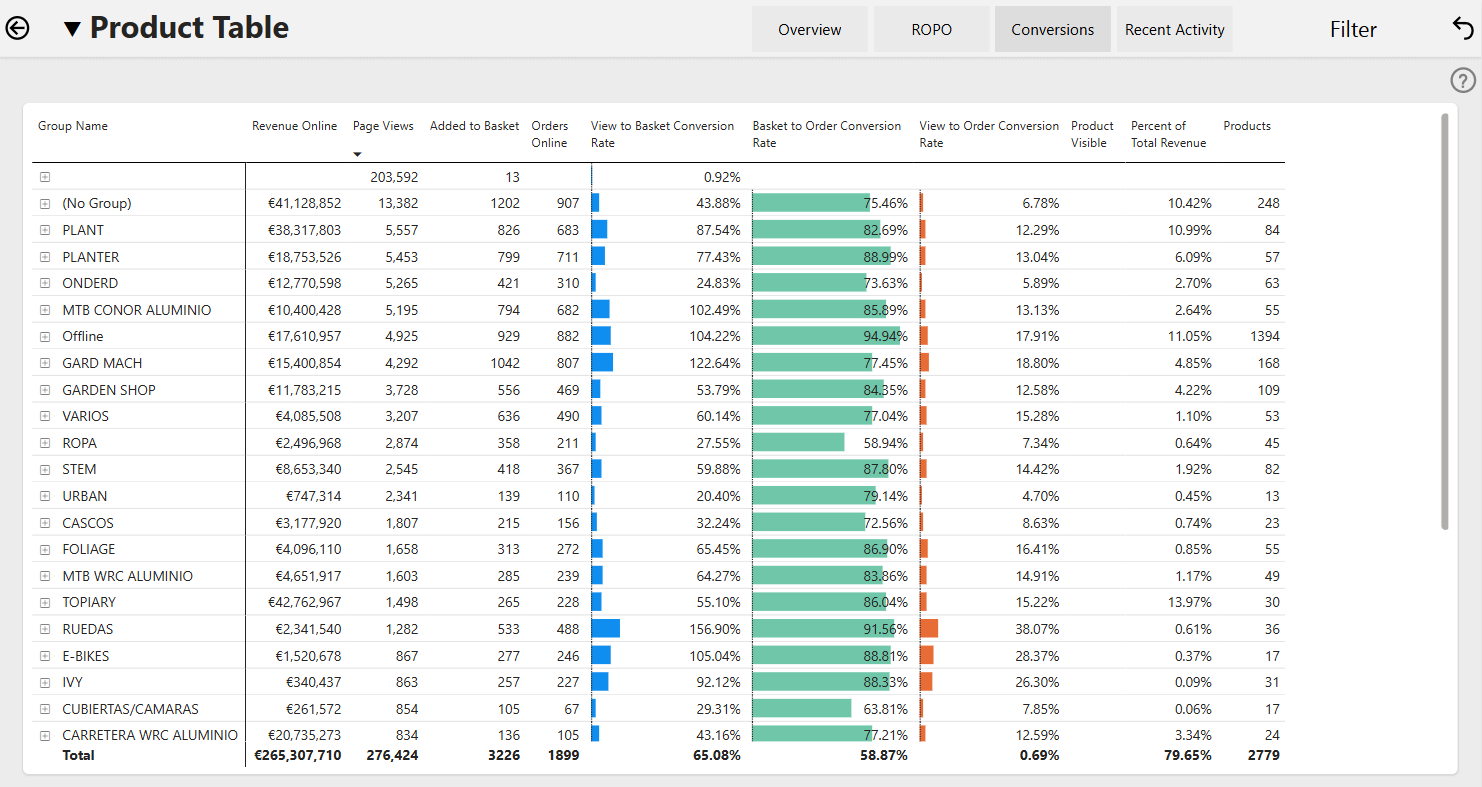
The Conversions table shows how effectively your webstore moves customers through the purchasing journey - from product view to order. It’s ideal for spotting friction points and identifying where engagement drops off, so you can optimize conversion flows.
This dashboard helps you analyze every step of the funnel:
- How many customers view a product?
- How often do those views result in baskets or orders?
- Where product interest fails to translate into action.
It’s your go-to view for identifying underperforming products, improving product content and UX, and turning webstore engagement into revenue.
How KPIs Are Defined
-
Revenue Online: The sum of all online revenue.
-
Product Detail Views: The number of product details page views.
-
Added to Basket: The number of products added to the basket.
-
Orders Online: The number of orders placed online.
-
View to Basket Conversion Rate: The number of baskets (open and closed) divided by the number of page views.
-
Basket to Order Conversion Rate: The number of online orders divided by the number of baskets (open and closed).
-
View to Order Conversion Rate: The number of orders divided by the number of page views.
-
Product Visible: By expanding the product group, you can see which products within it are visible or hidden on the webstore.
Recent Activity
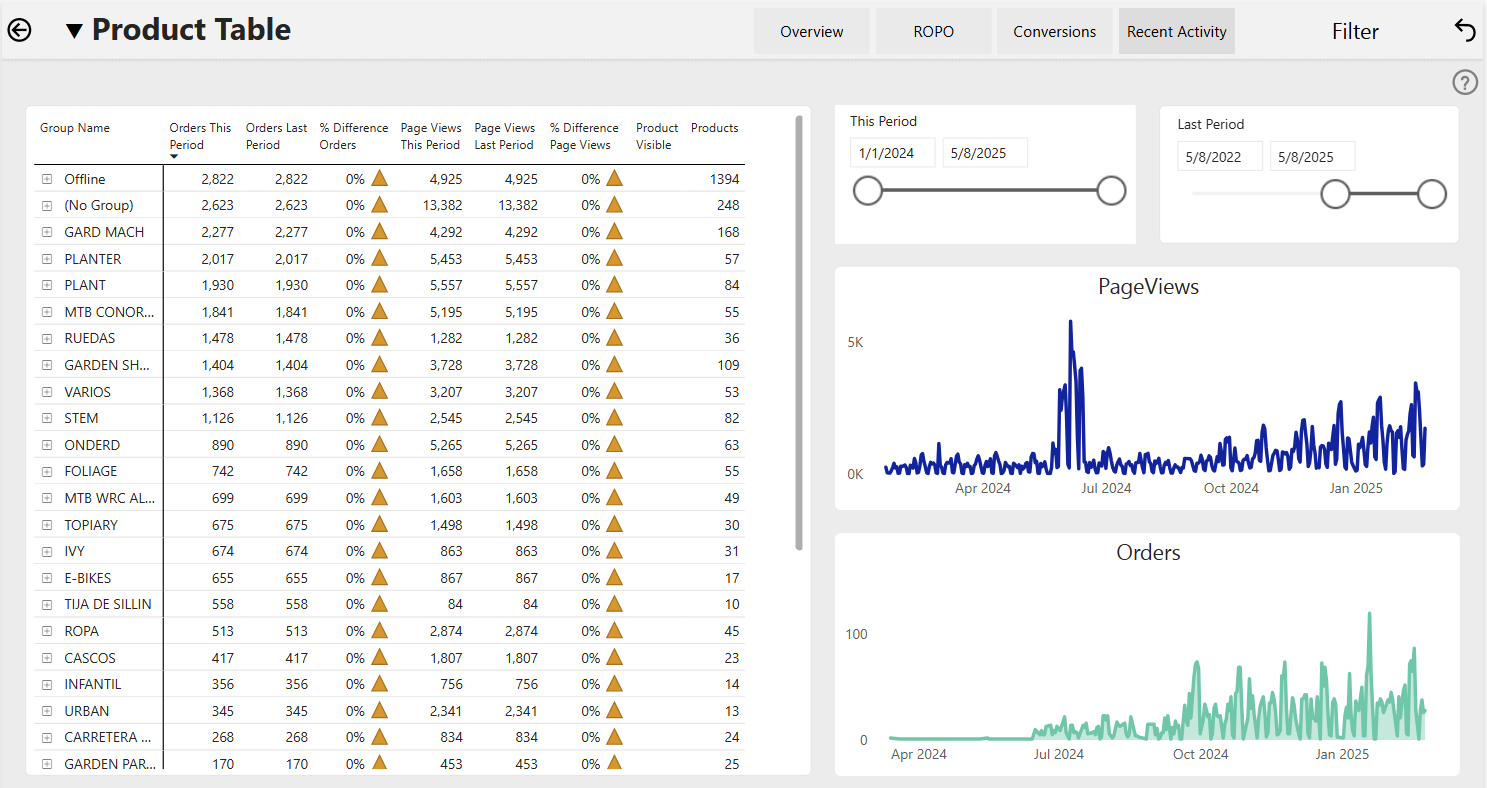
Stay flexible with the Recent Activity table, which tracks orders and page views for selected periods, compares periods to identify trends, seasonality, or the impact of recent promotions and changes. This dynamic view allows merchants to track short-term performance, evaluate campaign effectiveness, and respond quickly to changes in customer behavior.
How KPIs Are Defined
-
Orders This Period: The number of orders during this period.
-
Orders Last Period: The number of orders during the last period.
-
% Difference Orders: The difference between orders this period and orders last period divided by the orders this period.
-
Product Detail Views This Period: The number of product details page views during this period.
-
Product Detail Views Last Period: The number of product details page views during the last period.
-
% Difference Product Detail Views: The difference between product details page views this period and page views last period divided by the page views this period.
-
Product Visible: By expanding the product group, you can see which products within it are visible or hidden on the webstore.