Executive Overview
The Executive Overview page gives you a clear, high-level snapshot of how your business performs across both online and offline sales channels. Powered by ERP invoice data and enriched with Sana Commerce Cloud webstore data, this dashboard highlights key trends in revenue, orders, and customer activity, helping you steer your strategy with confidence.
Whether you're reviewing overall growth or comparing performance by channel, this view makes it easy to track progress and spot early signals that deserve attention.
It’s your go-to view for keeping leadership aligned on topline performance, surfacing key commercial KPIs, and quickly assessing the impact of your sales strategy.
Compare & Filter Tips
-
Use the Compare dropdown to analyze KPIs by sales person, customer group, product group, and more.
If your ERP doesn’t populate a given field (e.g. Sales Person), that comparison will appear empty.
-
Use Filter to narrow results based on time, geography, customer segment, or other attributes pulled from your ERP.
These KPIs, broken down into online and offline, give you a holistic view of how your business performs across different channels. With the help of statistics on the Executive Overview page, you can easily identify trends, monitor business health, and take proactive steps to enhance your sales strategy.
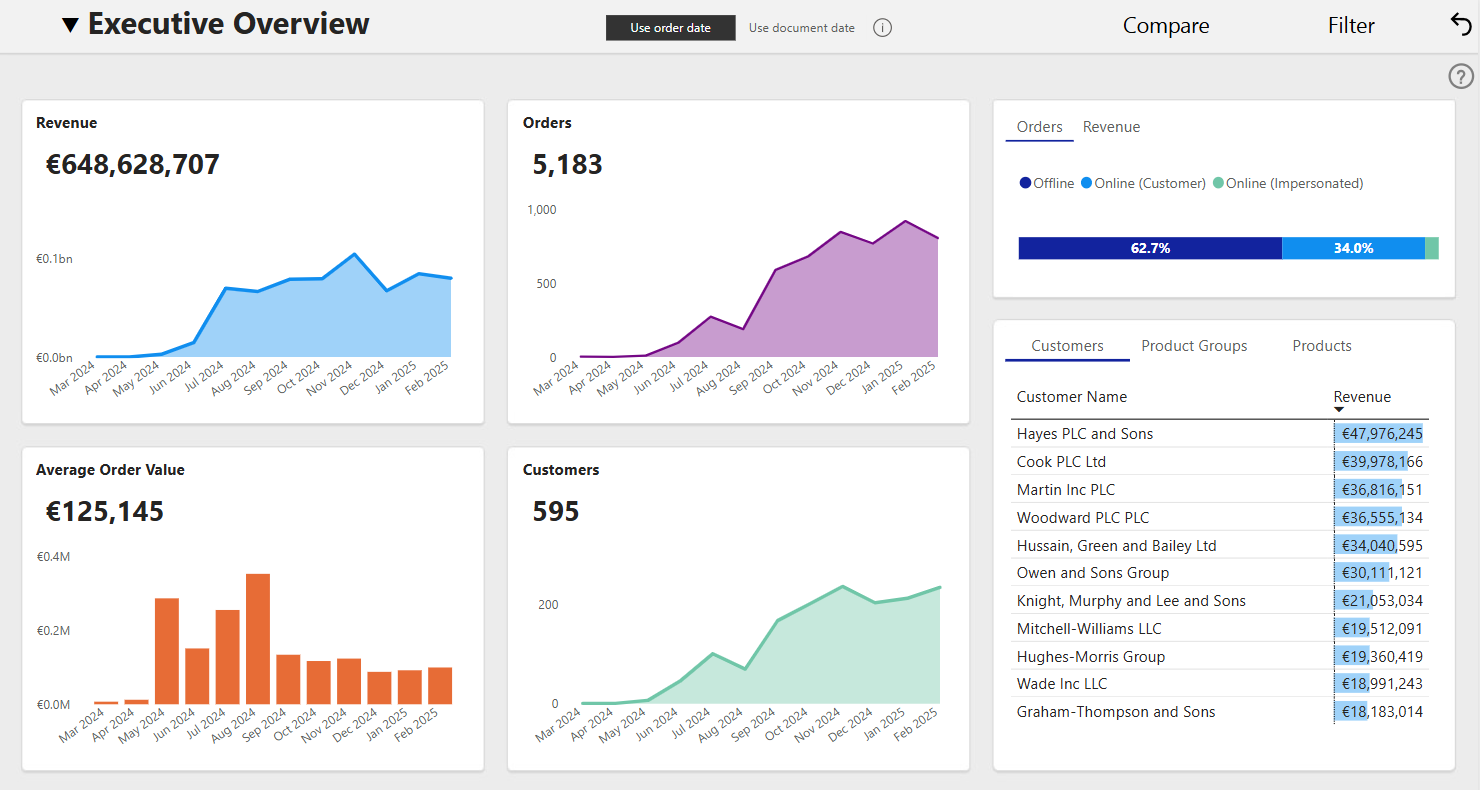
You can compare your KPIs across different dimensions using the Compare option in the top right panel. Notice that most comparisons are performed based on categories directly from your ERP. For example, if your company does not attribute orders to Sales Persons, the compare by Sales Person dimension in Sana Commerce Insights will be blank.
Metrics throughout Sana Commerce Insights can also be filtered after clicking on the Filter button.
How KPIs Are Defined
-
Revenue: The total, online and offline, revenue of your company, including taxes. In Sana Commerce Insights, this metric is equivalent to sales, as revenue is calculated based on posted invoices from the ERP.
-
Orders: The total number of orders. Orders are reported based on posted invoices from your ERP. Therefore, any new order will be included in the report only after it is invoiced.
Sana Commerce Insights looks at the order date in the invoice to determine when the order was placed. If the order date is missing in the invoice, it takes the document date instead. Keep that in mind when comparing the value reported in SCI with your ERP.
-
Average Order Value: Revenue divided by the number of orders. The value displayed below the metric title is the average order value calculated based on all data currently selected.
-
Customers: The number of unique customers who placed at least one order, online or offline. Similarly to orders, this metric is calculated with your ERP invoice data.