Customer Table
The Customer Table gives you a full view of how customers interact with your business across both online and offline channels. Divided into two sections - Overview and ROPO - it helps you analyze customer behavior, measure engagement, and understand how digital activity drives total revenue.
By connecting customer activity to revenue outcomes, this dashboard helps you:
- Spot high-value and at-risk accounts.
- Monitor adoption and buying patterns.
- Uncover how online interactions influence offline orders.
It’s your go-to view for segmenting customers by behavior and value, so you can tailor follow-ups, improve retention, and identify growth opportunities.
Overview
The Overview tab provides a detailed breakdown of customer activity, blending engagement data (page views, session length, basket activity) with ERP-backed performance metrics (revenue, orders, SKUs per order).
Use this table to:
- Track adoption and engagement at the account level.
- Identify customers with online interest but low conversion.
- Prioritize accounts for follow-up, based on activity and value.
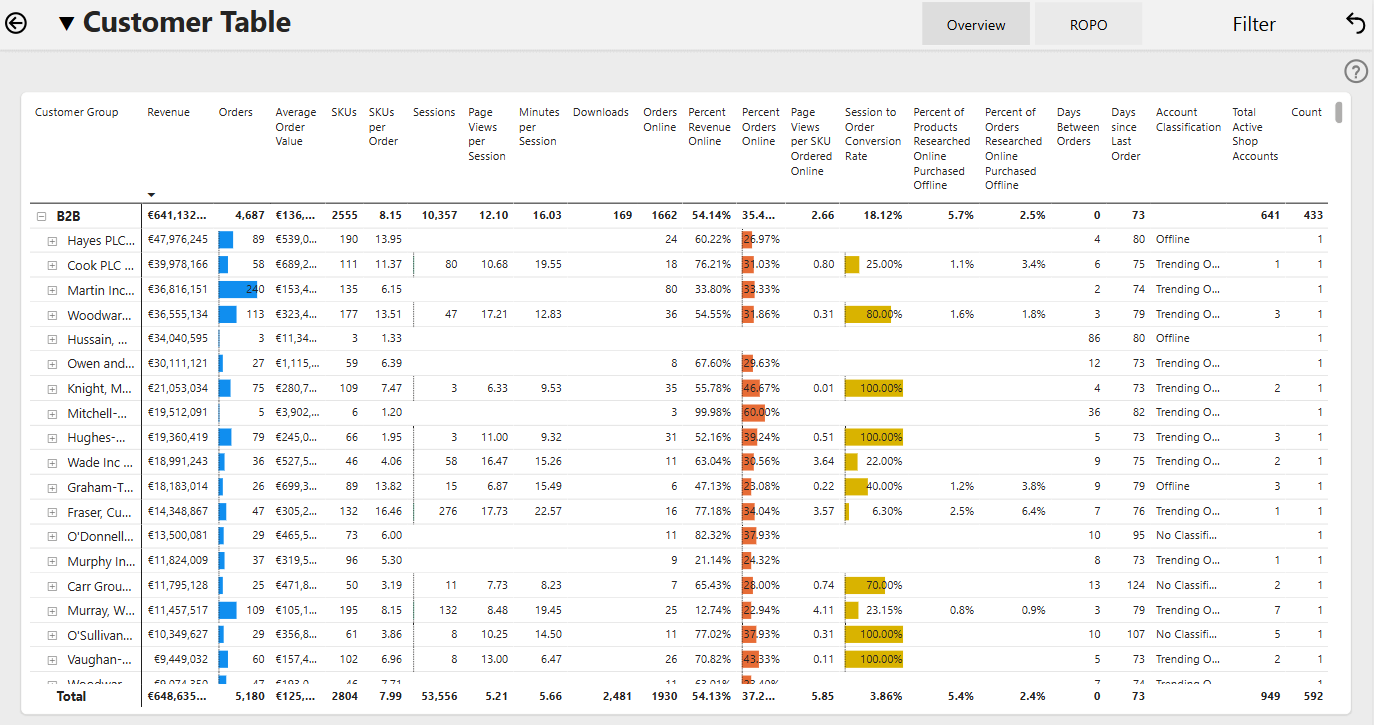
How KPIs Are Defined
-
Revenue: The sum of revenue per order line including taxes.
-
Orders: The number of orders.
-
Average Order Value: The average revenue per order, dividing total revenue by orders.
-
SKUs: Stock-keeping units.
-
SKUs per Order: Average stock-keeping units per order.
-
Sessions: The number of sessions.
-
Page Views per Session: The number of page views divided by the number of sessions.
-
Minutes per Session: The average duration of a session.
-
Downloads: The number of downloads.
-
Orders Online: The number of orders placed online.
-
Percent Revenue Online: The sum of all online revenue divided by all revenue.
-
Percent Orders Online: The number of orders placed online divided by the number of orders.
-
Page Views per SKU Ordered Online: The number of page views divided by the number of stock-keeping units.
-
Session to Order Conversion Rate: The number of online orders divided by the number of sessions.
-
Percent of Products Researched Online Purchased Offline: The number of products that are viewed online but bought offline divided by the number of all unique products sold.
-
Percent of Orders Researched Online Purchased Offline: The number of orders that were viewed online but placed offline divided by all orders.
-
Days Between Orders: The average amount of days between two orders.
-
Days since Last Order: The number of days between today and the date since the last order.
-
Account Classification: Based on the orders in the last 90 days. If no online orders are placed, the customer will be classified as “offline”, otherwise “online”. If the majority of orders are placed online, the customer will be classified as “trending online”, and if the majority of orders are placed offline, the customers will be classified “trending offline”.
-
Total Active Shop Accounts: The number of shop accounts.
ROPO (Researched Online, Purchased Offline)
The ROPO table shows how your webstore influences offline sales by tracking customers who research products online but place their orders through offline channels. These insights help you understand the full impact of your digital presence, even when purchases aren’t completed online.
By quantifying this cross-channel behavior, the ROPO table helps you:
- Reveal hidden revenue influenced by online activity.
- Align marketing efforts with offline buying behavior.
- Identify customers who are engaged online but prefer to purchase through traditional channels.
It’s your go-to view for demonstrating the real value of your webstore and turning online engagement into a strategic asset across your sales channels.
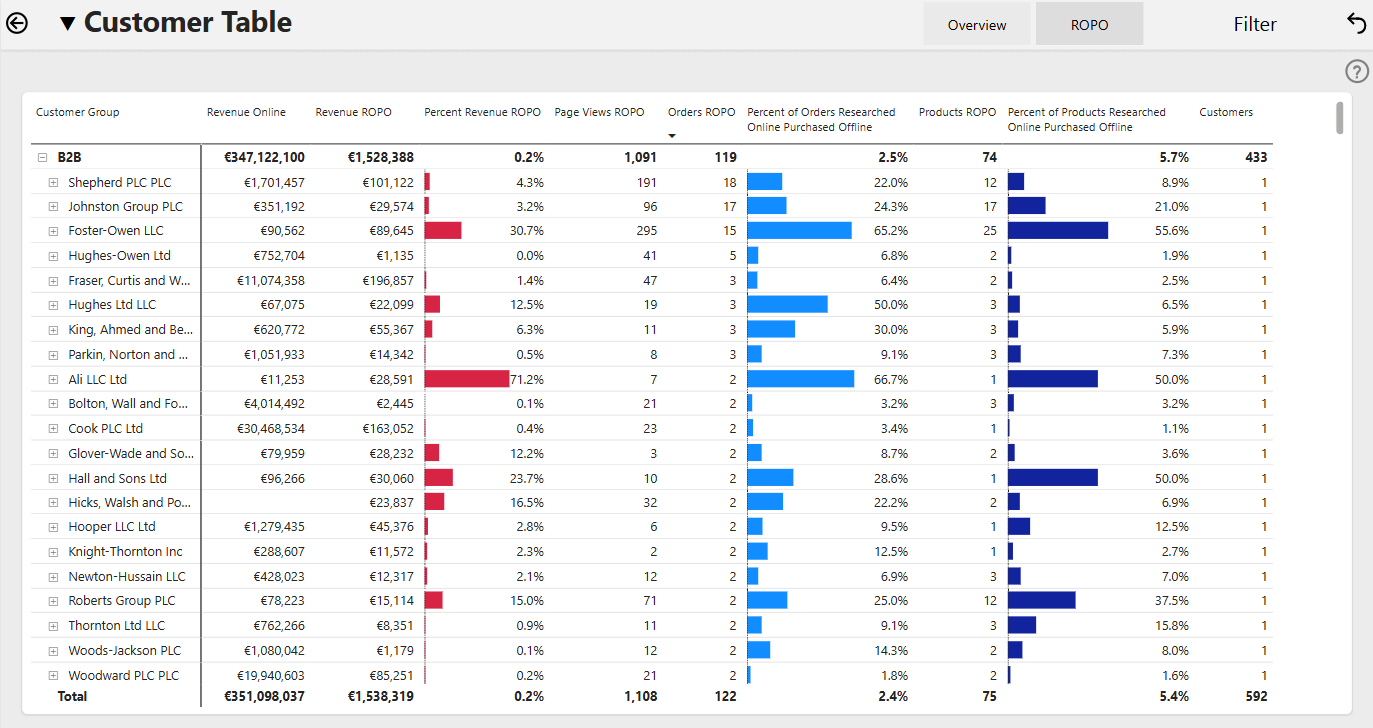
How KPIs Are Defined
-
Revenue Online: The sum of all online revenue.
-
Revenue ROPO: The sum of all revenue that was viewed online but bought offline.
-
Percent Revenue ROPO: The sum of all revenue that was viewed online but bought offline divided by the sum of all revenue.
-
Page Views ROPO: The sum of online page views and offline purchases.
-
Orders ROPO: The number of orders that were viewed online but bought offline.
-
Percent of Orders Researched Online Purchased Offline: The number of orders that were viewed online but bought offline divided by all orders.
-
Products ROPO: The number of products that were viewed online but bought offline divided by all products.
-
Percent of Products Researched Online Purchased Offline: The number of products that are viewed online but bought offline divided by the number of all unique products sold.
-
Customers: the number of unique customers who placed at least one order, online or offline. It is calculated based on your ERP invoice data.