Basic Features
In this article, you will learn about all the basic features of Sana Commerce Insights (SCI).
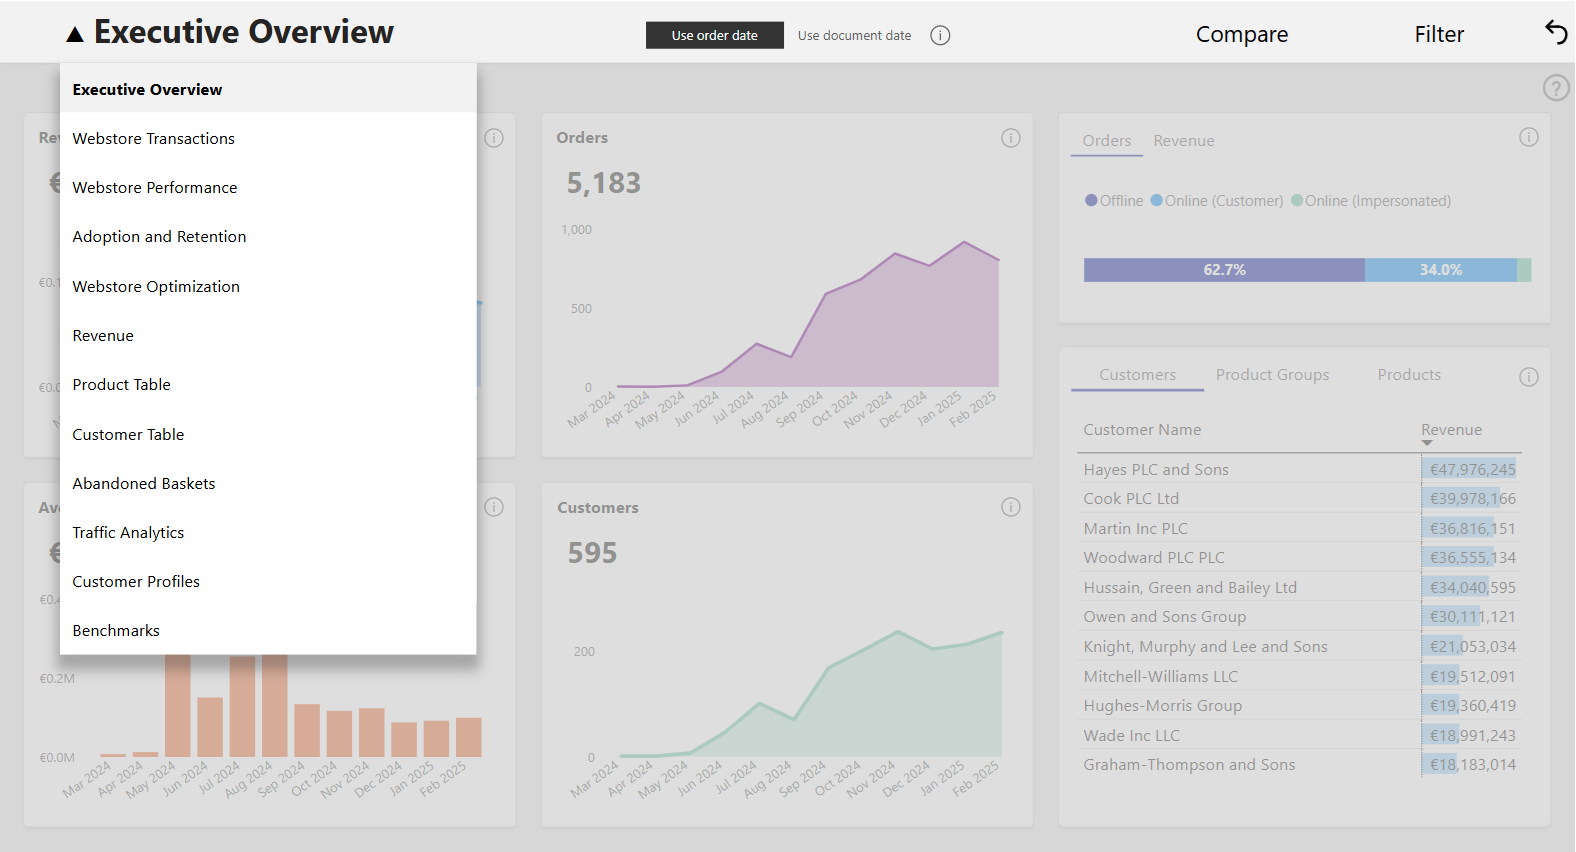
Navigation
Navigation allows you to go to different pages of the report.
Making Selections
Elements of the report are interactive - select a month or a customer for example to filter the rest of the visuals by that selection.
For example, you want to see an overview of online orders only.
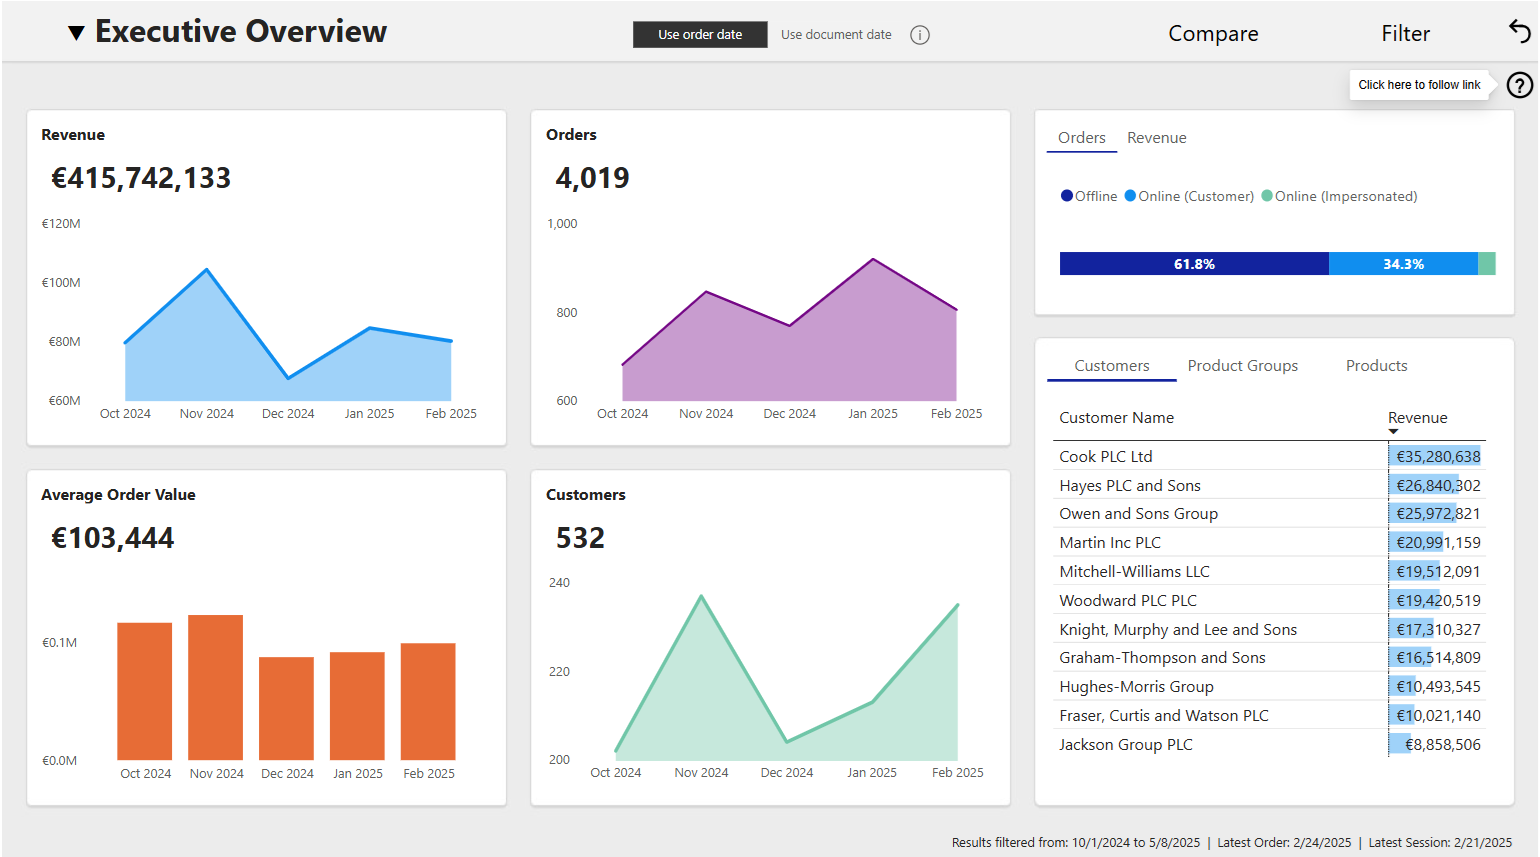
This is an example without selecting anything.
This is an example when the customer is selected.
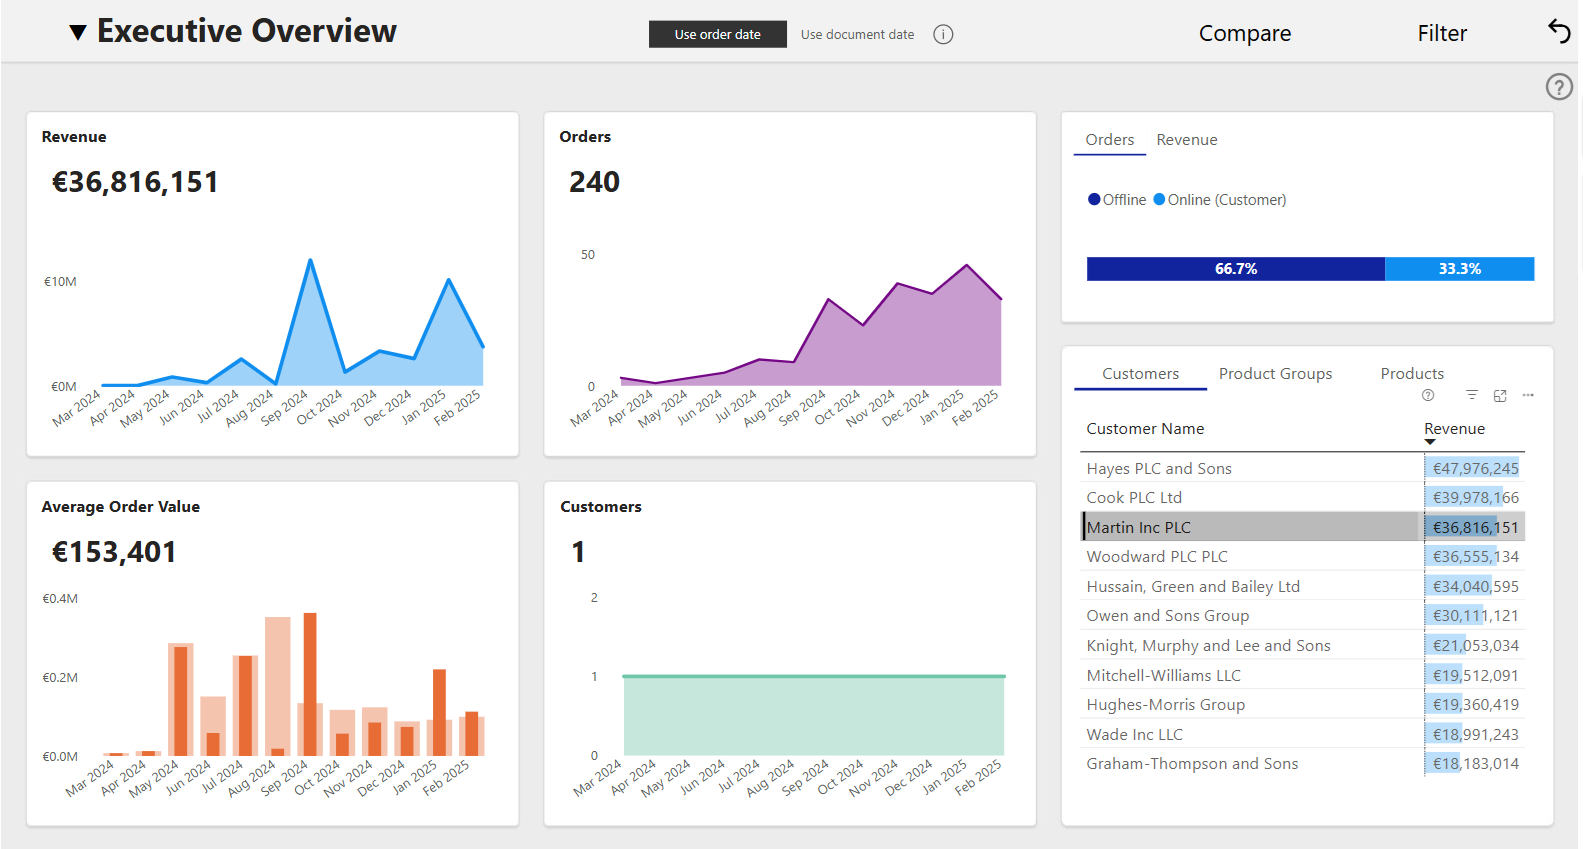
By holding down CTRL when pressing the left mouse button, you can select multiple items at once. When you’re done, click on a selection again to reset it to the default state. Alternatively, you can click on the reset button to go back to the default selection.
Tooltips
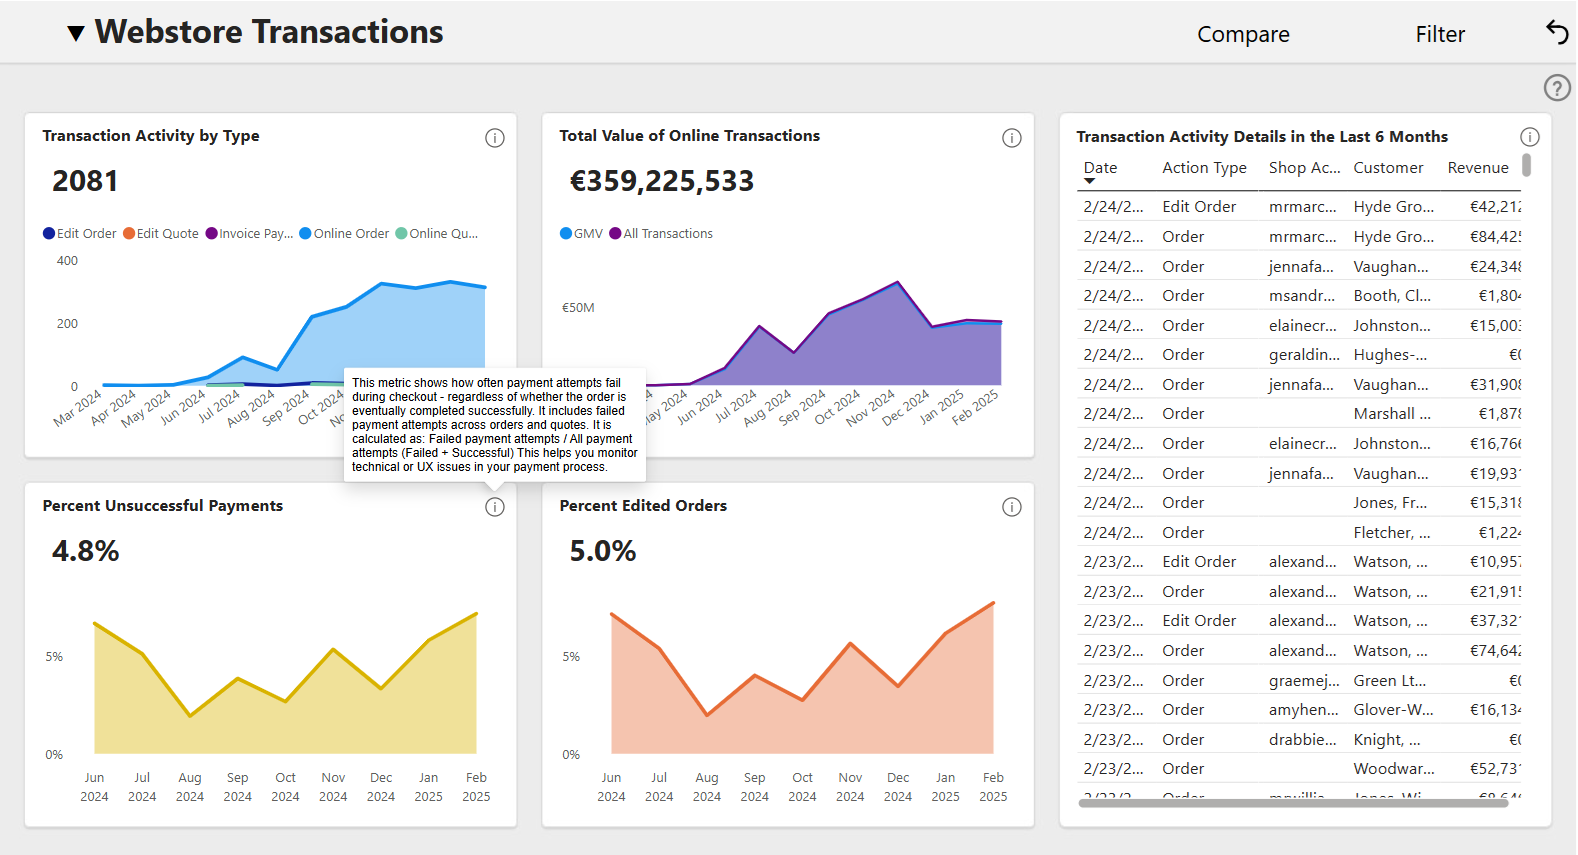
To gain further insights from these visuals you may take advantage of tooltips. Hover the mouse cursor over an element and a tooltip will pop up with more information.
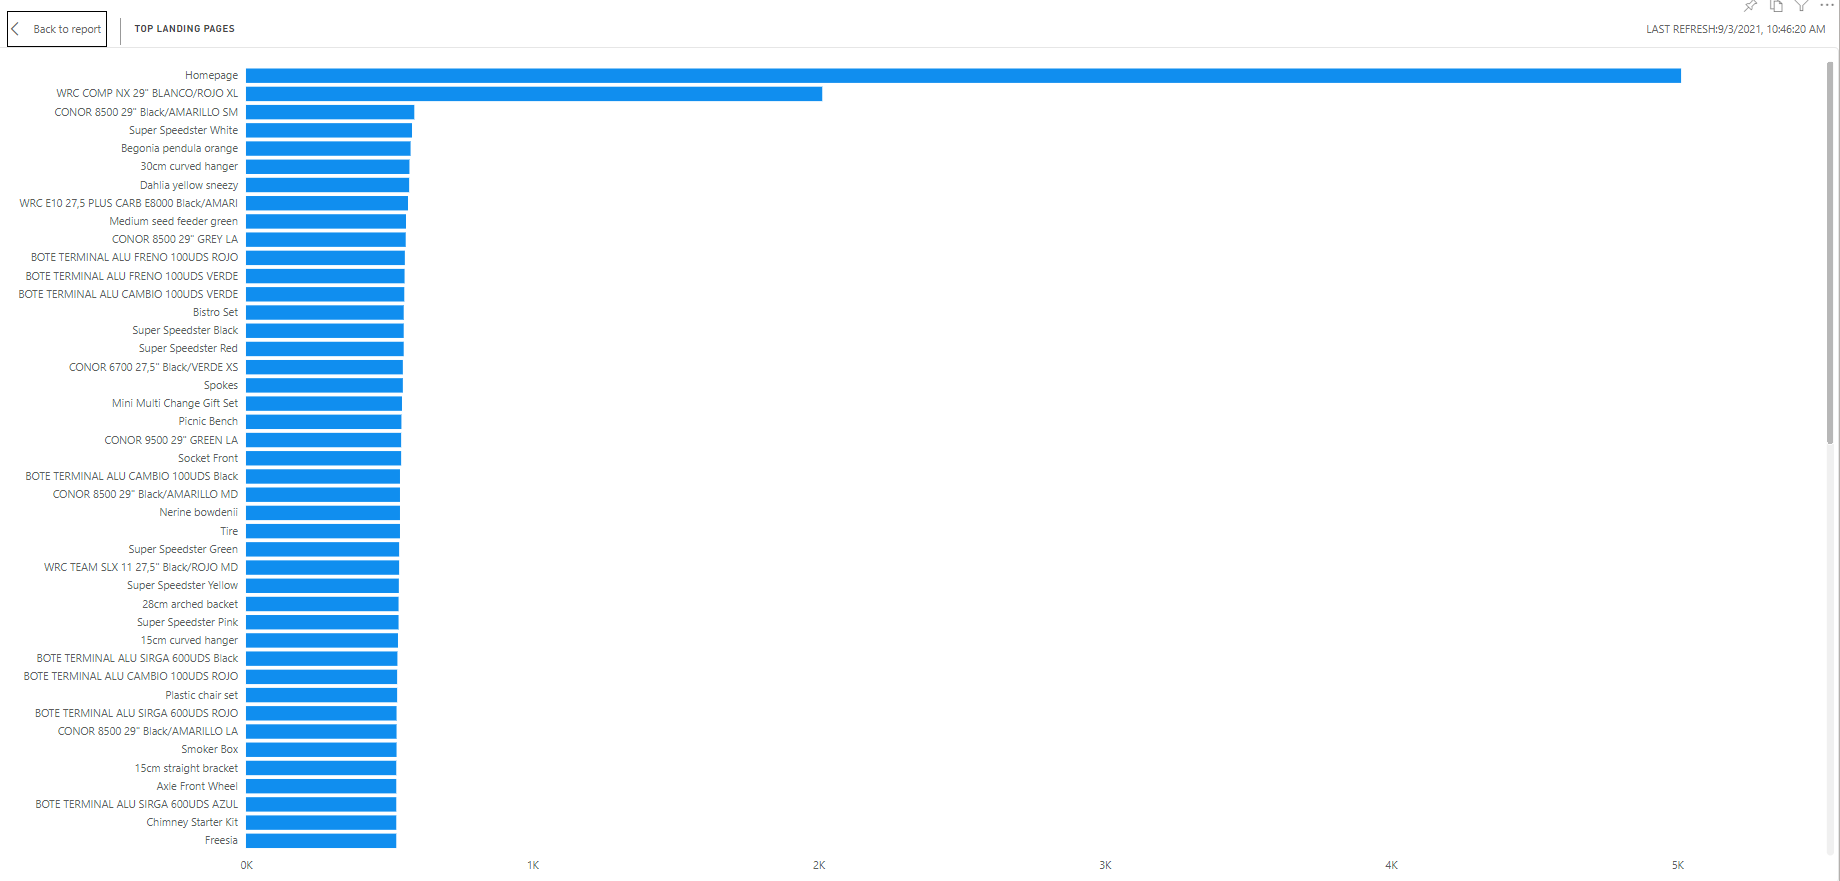
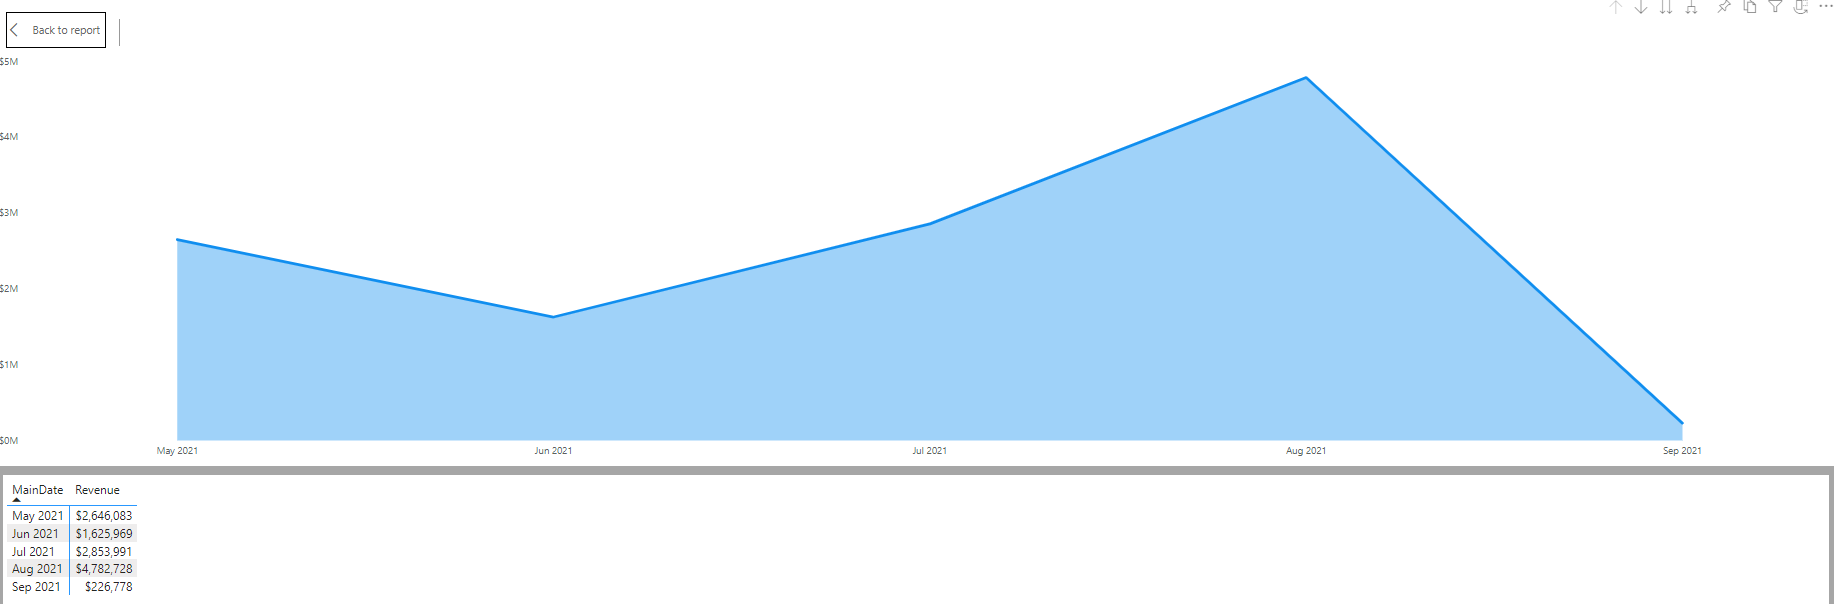
Drill Through, Drill Down, and Tables
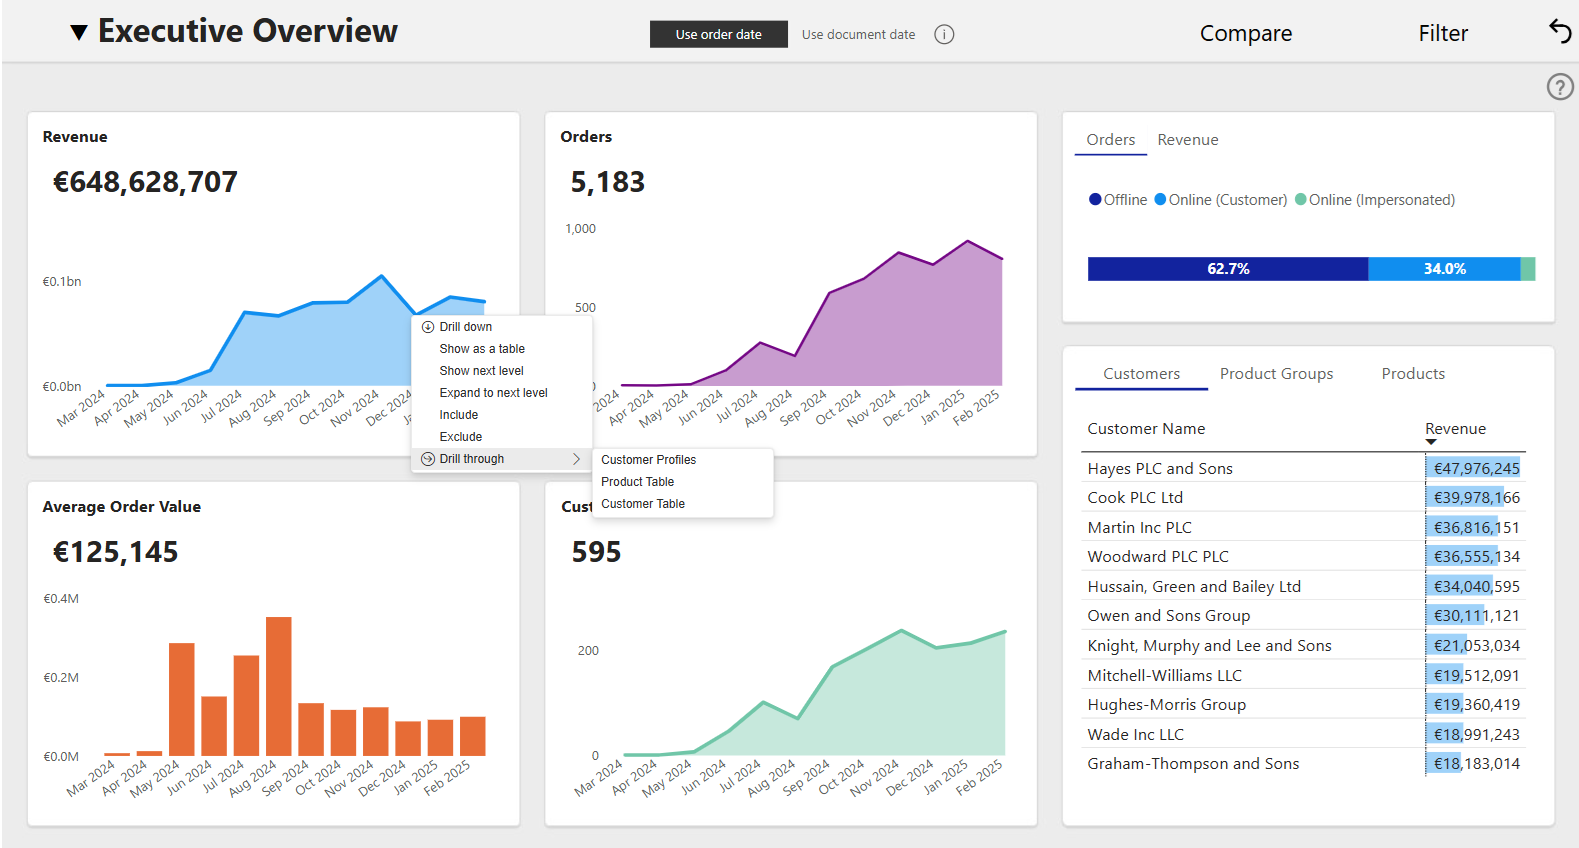
Drill Through is a feature that allows you to move from a more general presentation of data to a more specific one. If you right-click on a graph, a context menu will appear with the option Drill through (only when this option is available). When you hover your mouse cursor over the option Drill through, you can see which page you can drill through.
-
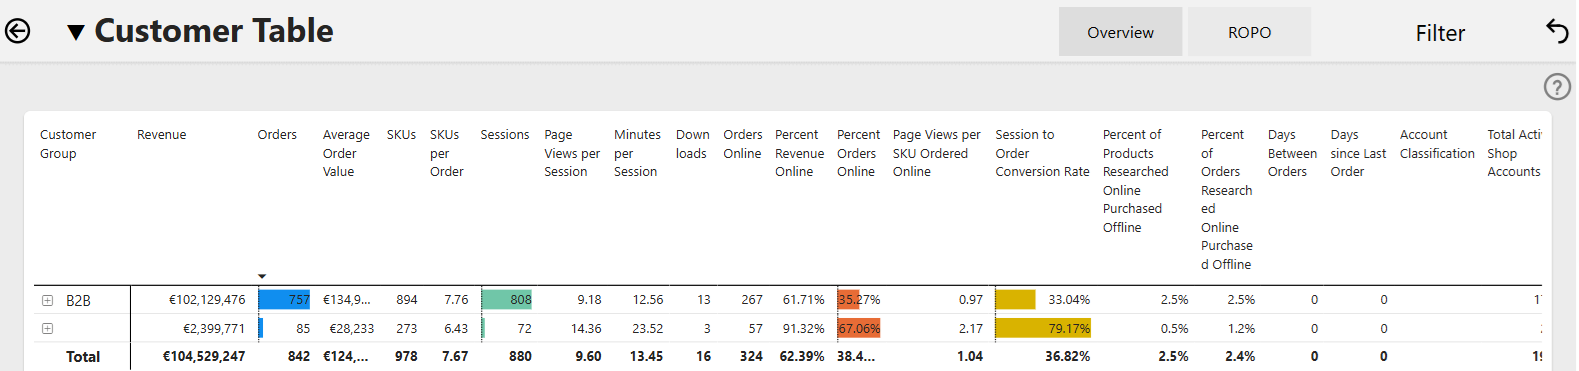
Sort the table:
- Click on the column header you would like to sort by.
- To sort by ascending or descending order, click the column header once again.
-
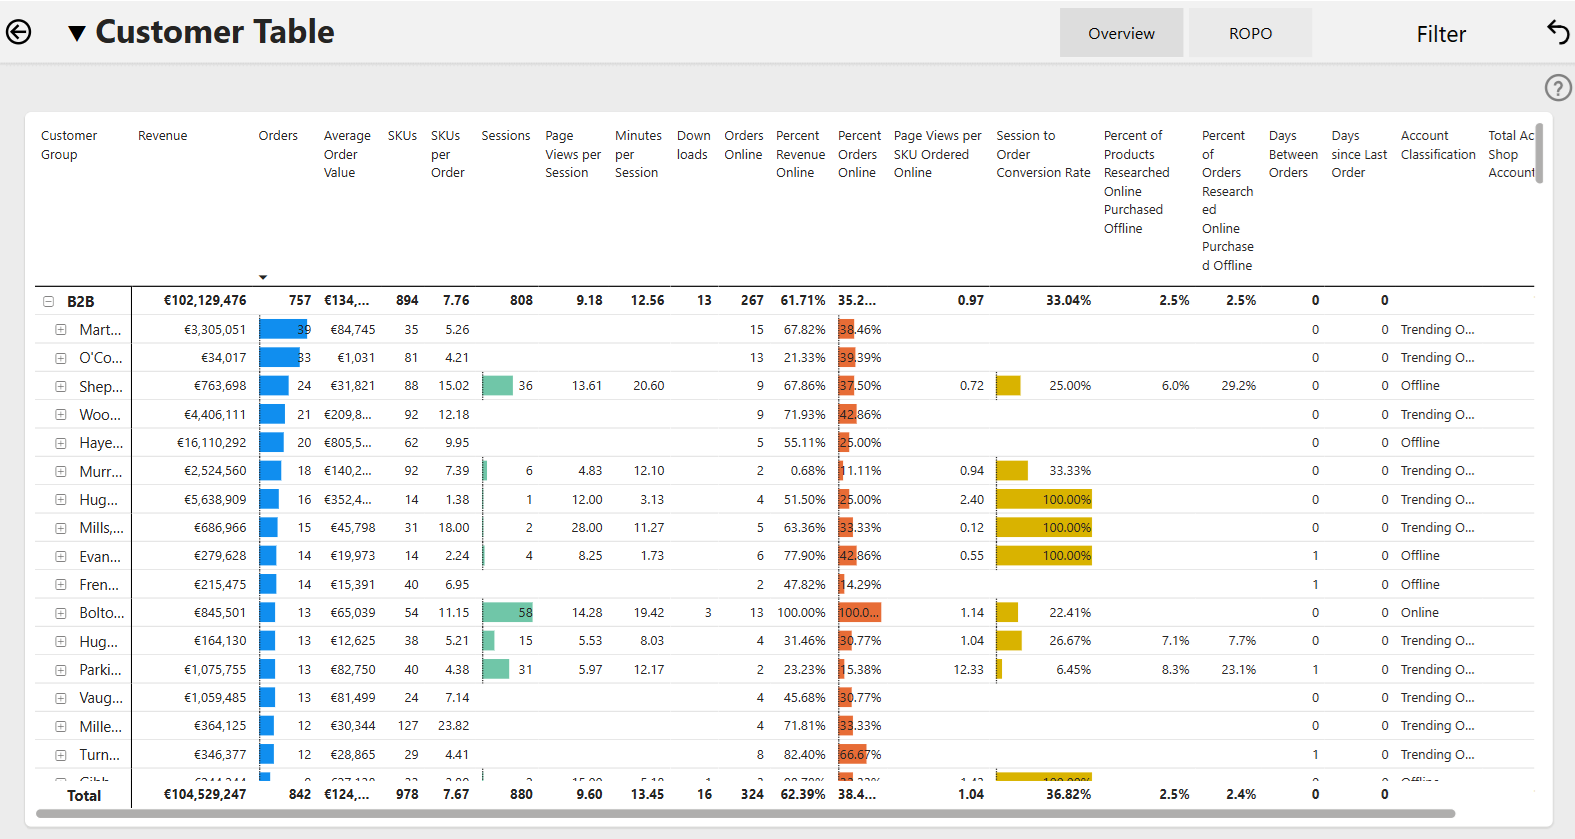
Drilling Down shows a deeper level in the hierarchy. There are a few ways to drill down:
- Click the down arrow, double click on the group you want to drill down on.
- Click the double down arrow to drill down across all groups and remove grouping.
- Click the split down arrow to drill down across all groups and retain grouping.
- Lastly, you can use the expand/collapse buttons (+ or – ) to drill down or up.
-
Drill up one level by clicking the up arrow button, or reset entirely by clicking the reset button (this also removes filters).
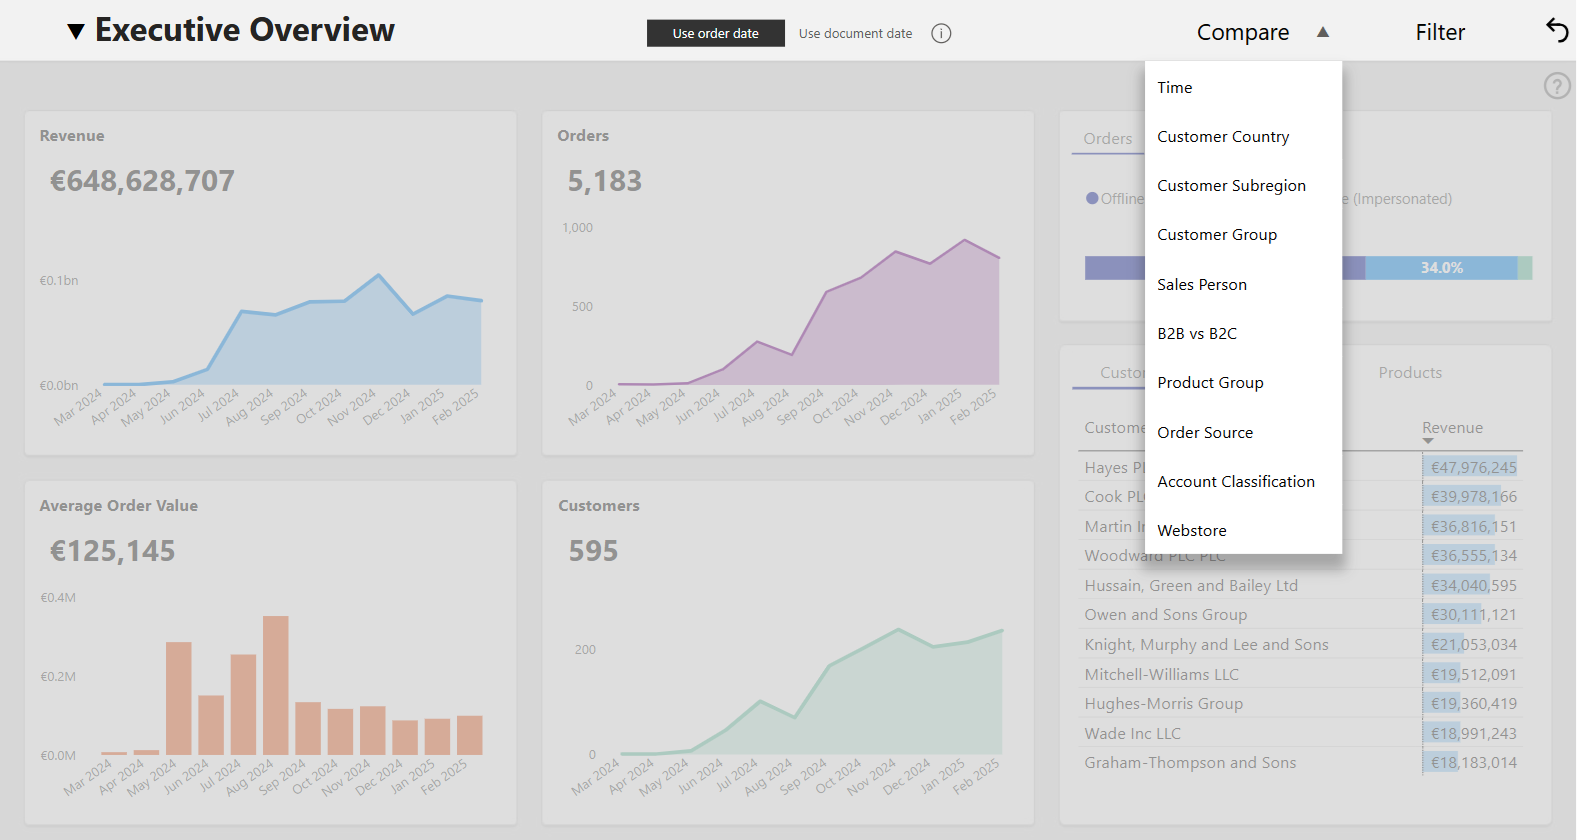
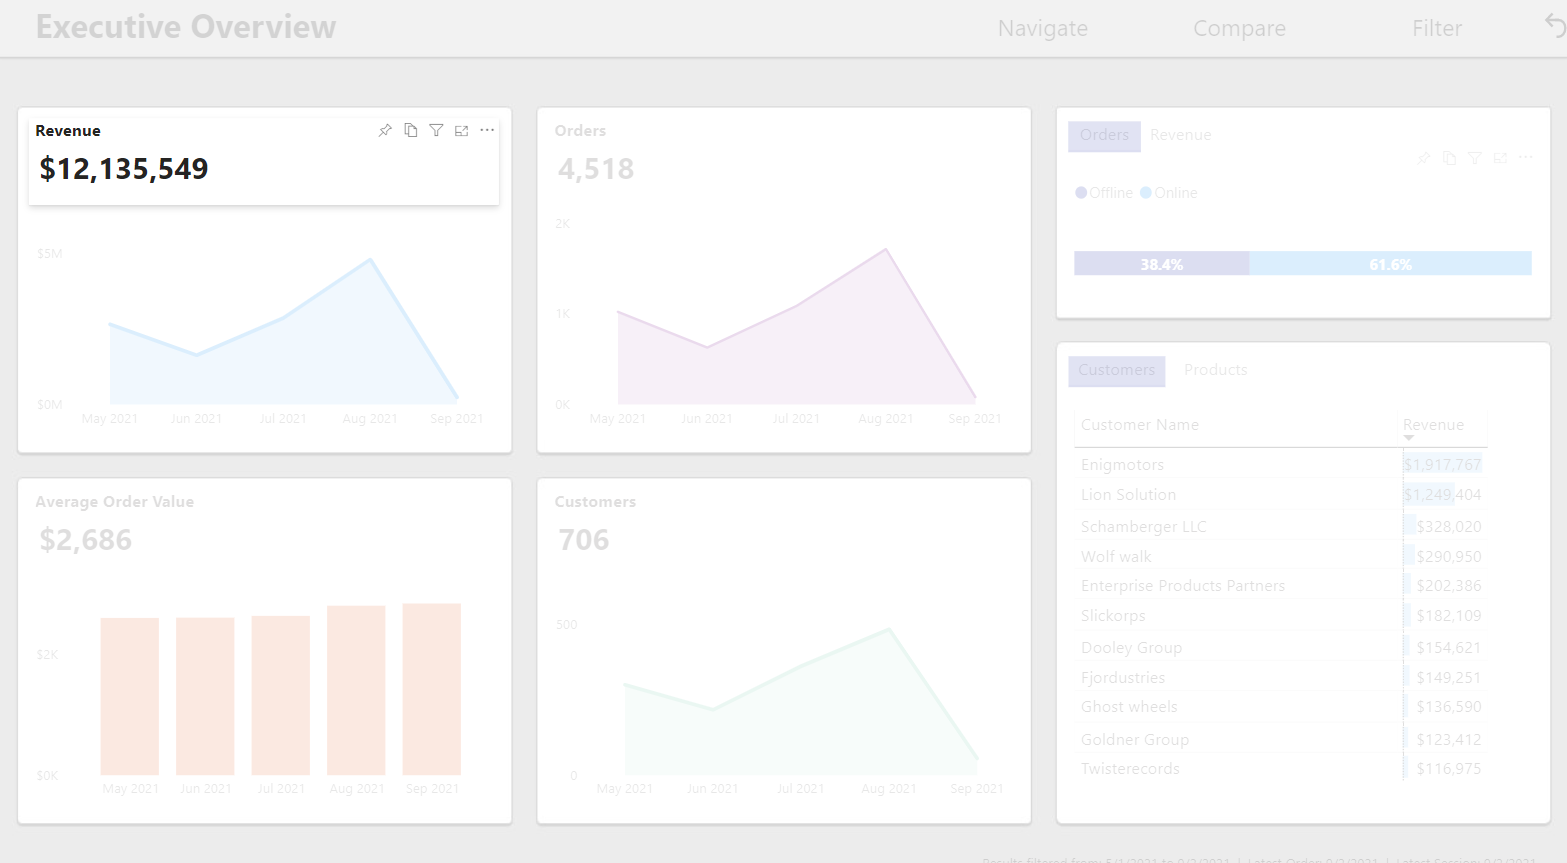
Compare
The compare button allows you to see visuals by different dimensions such as time, industry, traffic source, and so on, or to see different views for specific pages.
Below you can see an example of the Executive Overview page. If you select a dimension you want to compare, the presentation will change automatically.
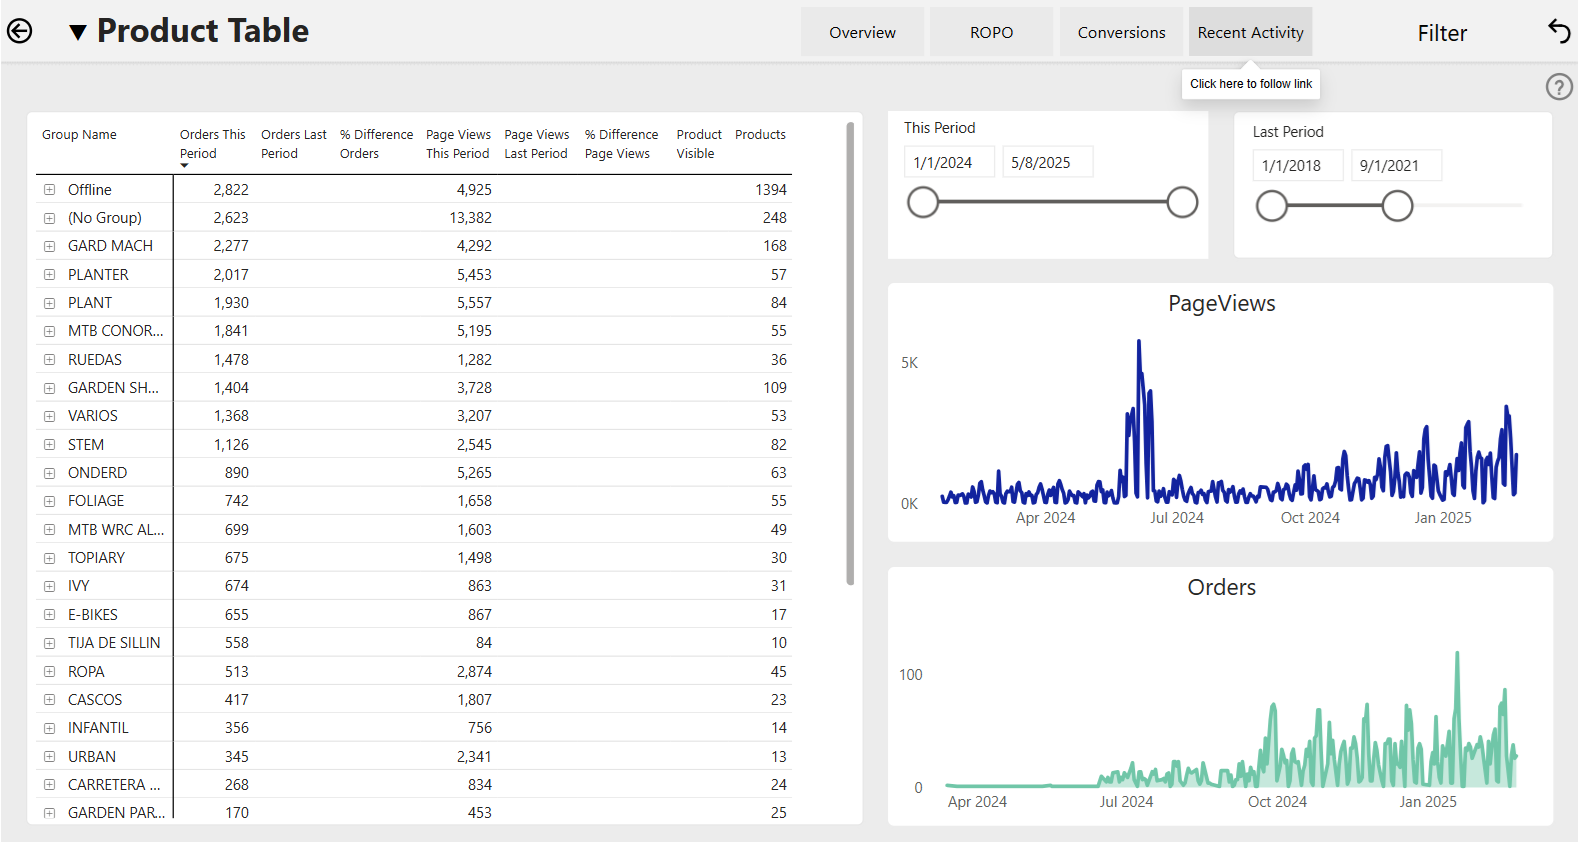
Below you can see an example of the Product Table page. If you select another view, the presentation will change automatically.
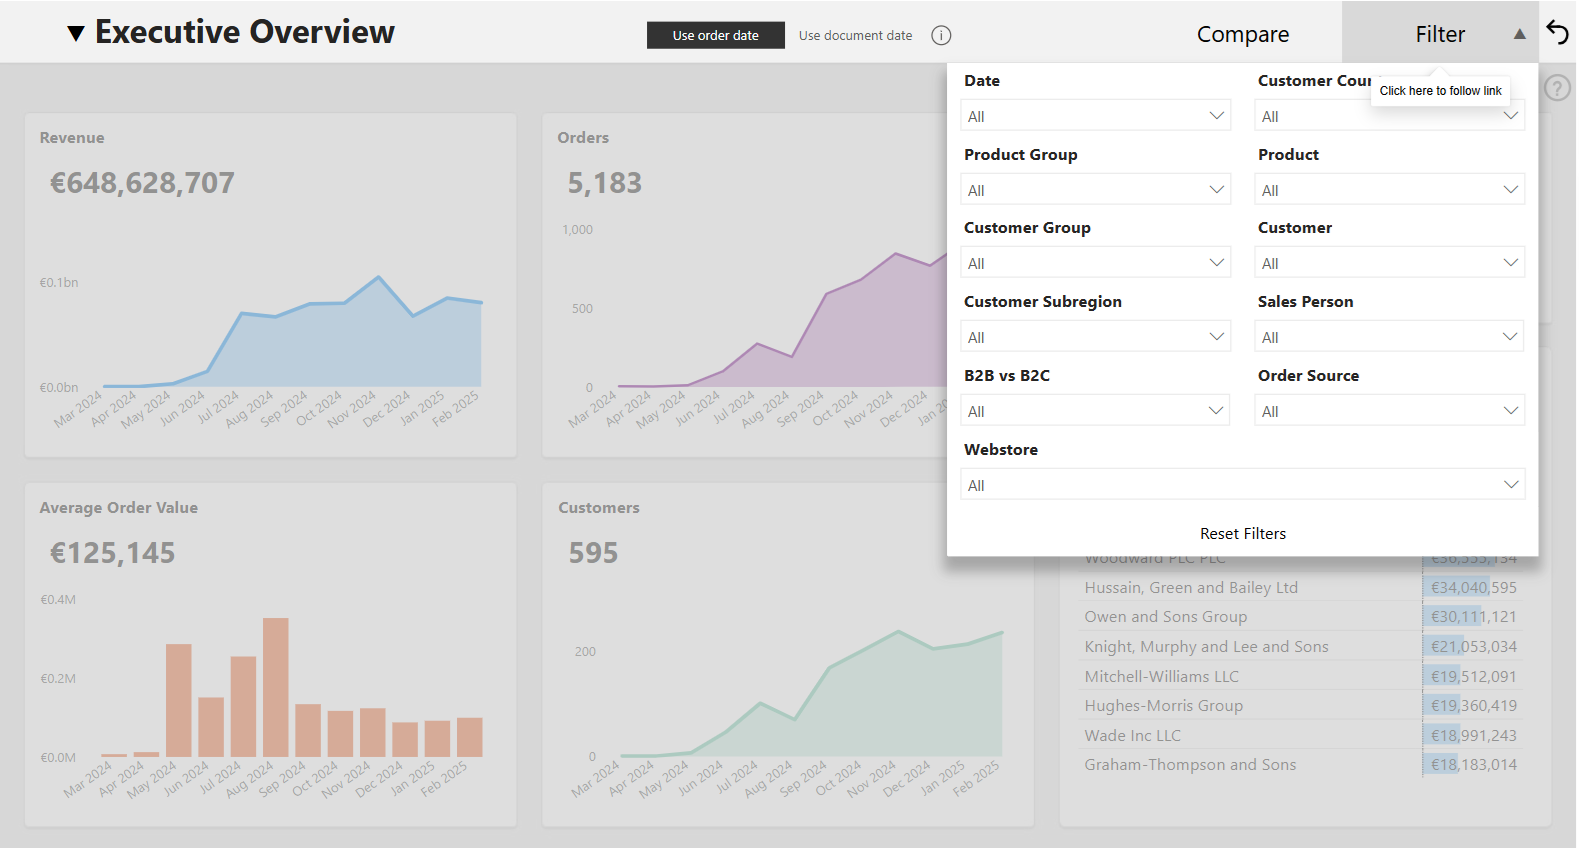
Filter
The Filter button allows data to be filtered by Date, Medium, Product Groups, and so on. To filter, select the filter you would like to apply.
Extra Features
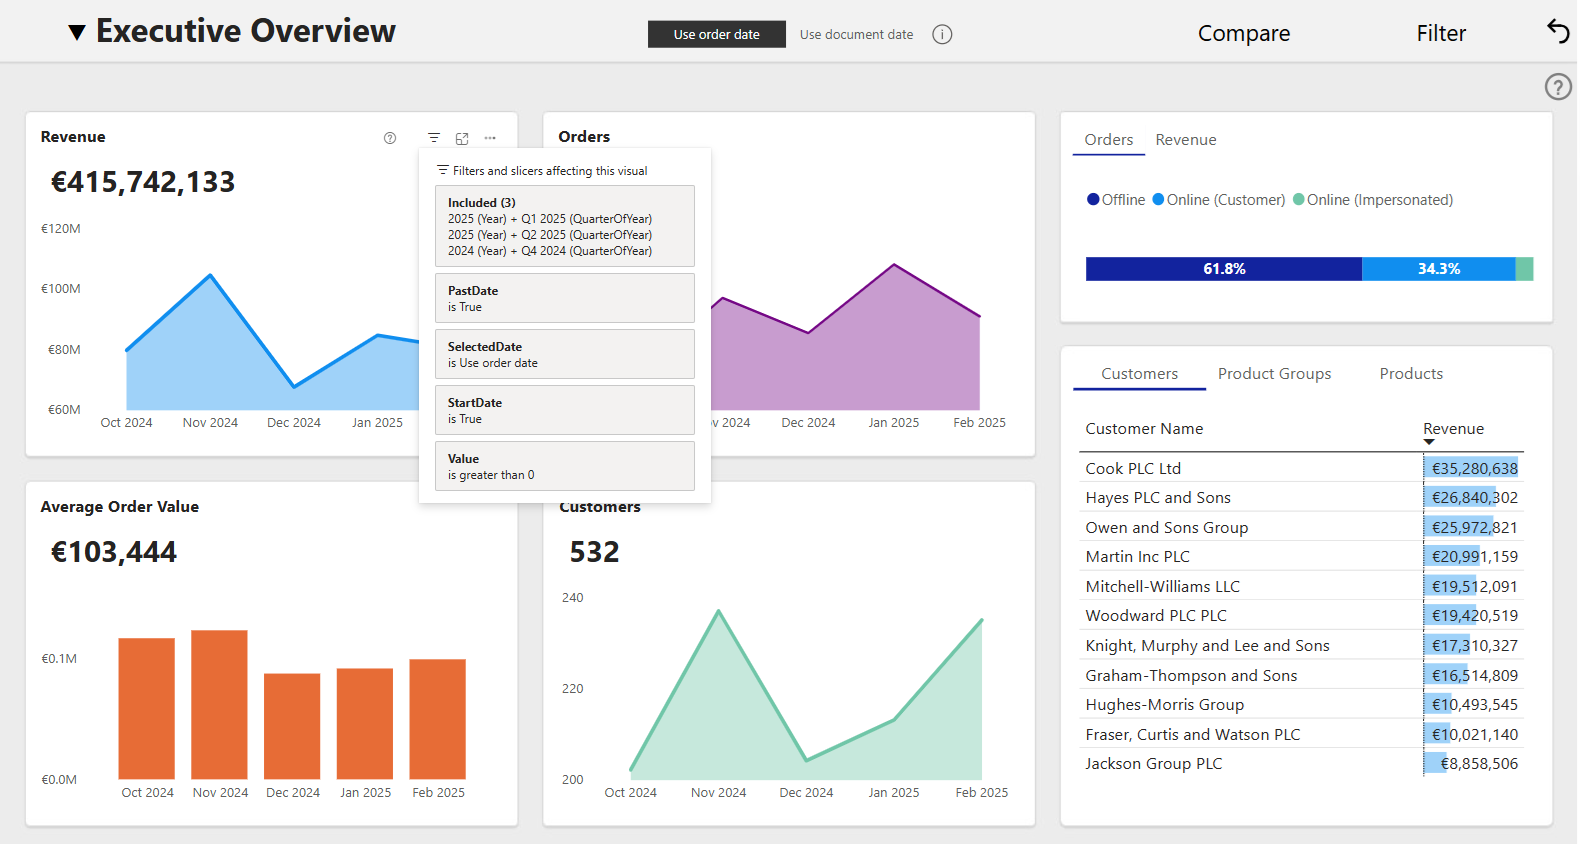
There are some extra options available for most elements of the report. You can see them by hovering over the top right corner of the element.
-
Filter: Shows the filters currently applied to that visual.
-
Focus Mode: Focuses on that visual.
-
Click on the More options button to see other available options:
-
Spotlight: Puts a spotlight on that visual.
-
-
Show as table: Presents the information in the visual as a table.
-
Question Mark: The Question Mark in the upper right corner of the page will direct you to the documentation for this page on the Sana Support website.