Sana Commerce Insights 1.23.0
Release date: October 9, 2023
Learn about new features, improvements, and bug fixes in this release.
What’s New?
Use the New “Webstore Transactions” Page to Get a Fuller Picture of What is Happening in Your Webstore
Your Sana webstore can be so much more than just an ordering portal. For example, B2B buyers can request quotes or pay their outstanding invoices online. They can also edit both quotes and orders whenever and wherever is convenient for them.
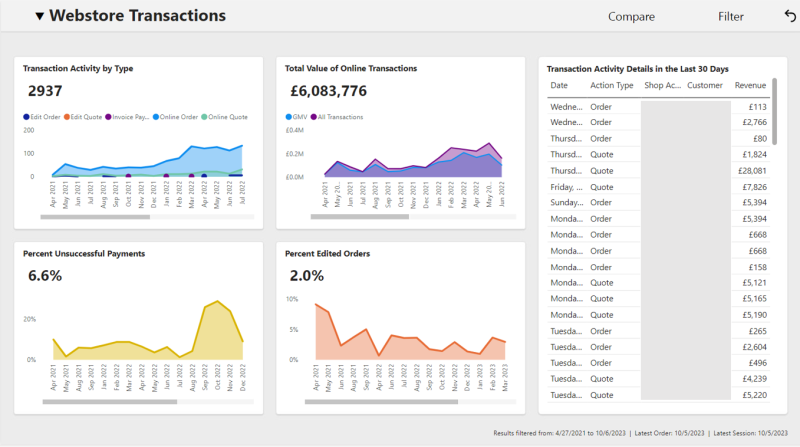
We know how valuable it is to get insights into these activities, that is why we are excited to introduce to you the new section of the Sana Commerce Insights report called Webstore Transactions.
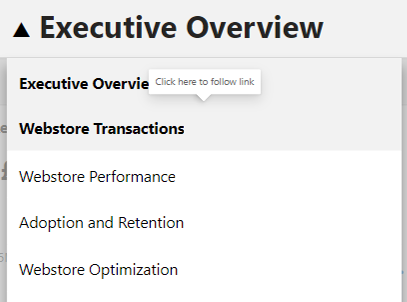
You can find this new page in the main navigation menu, directly under Executive Overview.
This section of the report is all about activities that involve the checkout process which include placing sales orders and sales quotes, editing sales orders and sales quotes, as well as paying invoices online.
Usually the Sana Commerce Insights report uses posted invoices from your ERP system as a data source for ordering behaviour. You should keep in mind that the Webstore Transactions page is built differently. Data comes directly from the database of your webstore which has several implications:
-
You don’t need to wait for the corresponding invoice to be posted before you see an order included in the report.
-
If an online order is edited or cancelled in the ERP system these actions are not tracked. The order will be reported in the form that was sent from Sana to your ERP. It works the same for the online quotes.
-
Only online activity is included while orders or quotes created in the ERP system are not reported on the Webstore Transactions page.
These new additions don’t change the way that the rest of the report functions, therefore on the Executive Overview page you can still see data based on posted invoices.
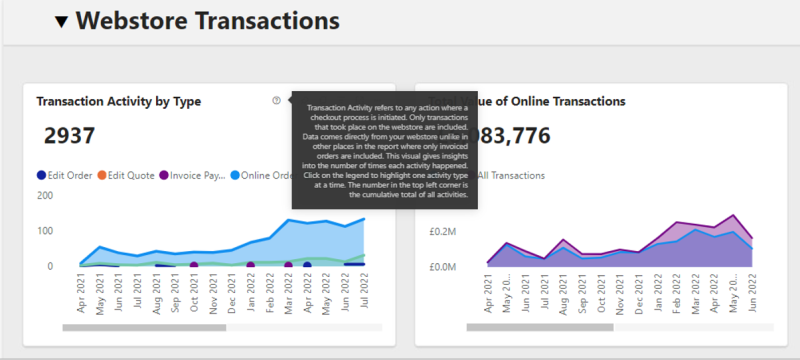
As always, we included help tooltips to provide you with a thorough explanation of the metrics.
The page consists of five visuals, which are crucial for understanding the performance of your webstore.
In the top left corner, you can see the Transaction Activity by Type graph which gives you clear insights into the number of times a certain activity was undertaken. If you hover over any date on the graph you will see how many times your Sana webstore facilitated a specific business process. You can see the insights for a specific type, to do this you need to click on the necessary type. If you need to see the insights for several types, hold CTRL and select them. Keep in mind that all activities are included regardless of their payment status, for example an attempted invoice payment that ended with a payment error is also counted.
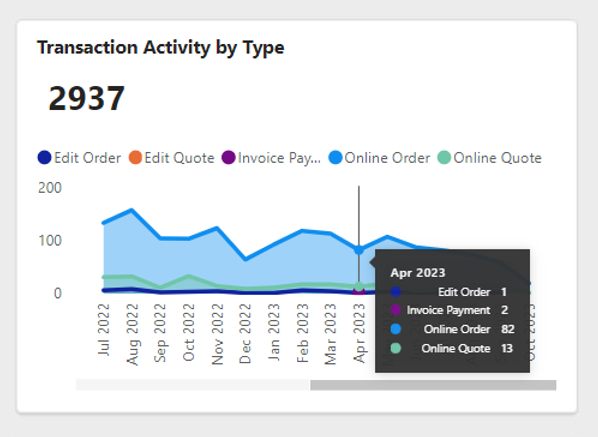
Knowing how many orders and quotes were submitted and edited, and invoices paid from your webstore is crucial, but it is also equally important to know the monetary value of these transactions.
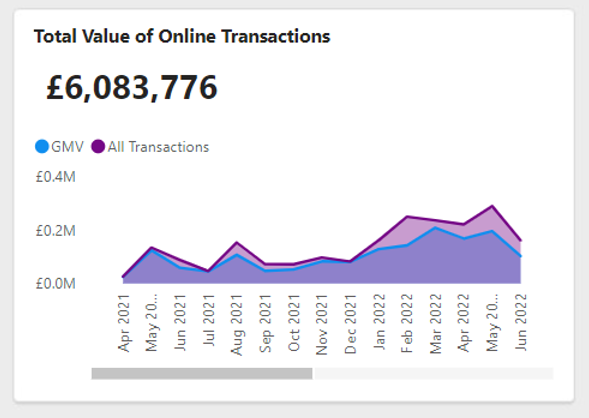
You can learn all about that from the graph called Total Value of Online Transactions. Note that only successful transactions are included in this calculation.
We differentiate between GMV which doesn’t include quotes and All Transactions which include quotes. If your webstore doesn’t support quotes, the two numbers will always be the same. If an order or a quote was edited online, only the latest version is considered in the calculation.
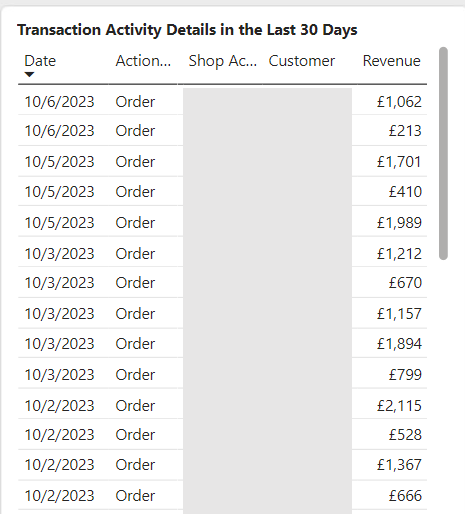
A frequent point of feedback we receive from our users is that they don’t want to wait for invoices to be posted before they can see what happened on their webstore, for example yesterday. This shouldn’t be a problem anymore. We added the table called Transaction Activity Details in the Last 30 Days which is sorted chronologically and it provides details about each checkout process, its value and the customer and shop account behind it.
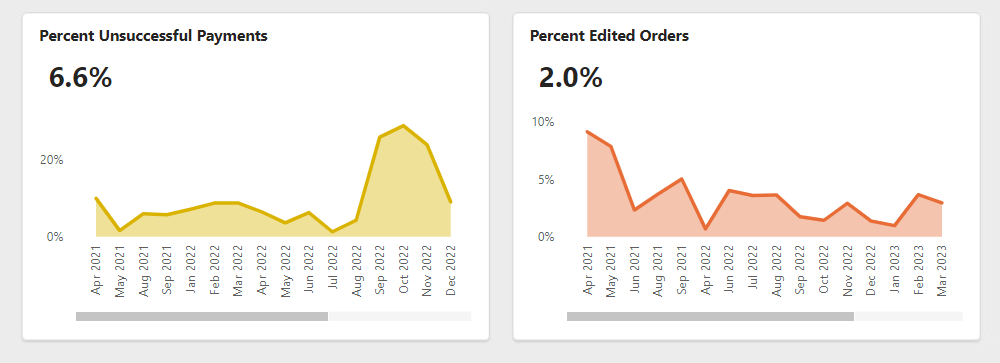
Lastly, keeping in mind how important it is to provide B2B buyers with a seamless online experience we included two graphs which help to track when things go wrong. By monitoring the new KPIs - Percent Unsuccessful Payments and Percent Edited Orders – you can be sure that the shopping experience of your buyers is not disturbed by payment errors or difficulty finding products that are available soon enough.
Note that if all orders in your webstore are placed on account, there will be no unsuccessful payments and the Percent Unsuccessful Payments graph will be empty. Similarly, if buyers do not edit orders online, the Percent Edited Orders graph will be empty. This is a standard way of how Power BI deals with the value 0.
The Compare and Filter menus present on the Webstore Transactions page work in the same way as on other pages.
We hope that exploring webstore transactions data will lead to valuable insights and tangible actions that will enable you to improve your e-commerce business. Since this is the first time that Sana Commerce gives B2B merchants such insights into their webstores, we are extremely curious to hear from you about ways we can further improve this section of the report.
Bug Fixes
- Fixed the issue with Sana Commerce Insights Preview reports not refreshing to include the latest data.
- Fixed the technical issue that was causing slowness of the Sana Commerce Insights Reports during certain times of day.
- Fixed an issue with scheduled data offload for customers using Sana Commerce Insights+.
