Sana Commerce Insights 1.21.0
Release date: July 21, 2023
Learn about new features, improvements, and bug fixes in this release.
What’s New?
Learn Everything About Internal Search With a Brand New Searches Subpage
Do you want to know what your customers are looking for in the webstore and whether they are finding relevant results? Our new Searches subpage can provide you with the answers to these questions.
Understanding searching behavior can help you to uncover patterns in the popularity of certain products and can help you to discover that your customers might be interested in products your webstore doesn’t offer yet. Besides, if you understand the searching behavior, you can effectively improve the setup of your product catalogue in Sana and in this way ensure a smooth search experience for your users.
You can find the Searches subpage on the Traffic Analytics page.
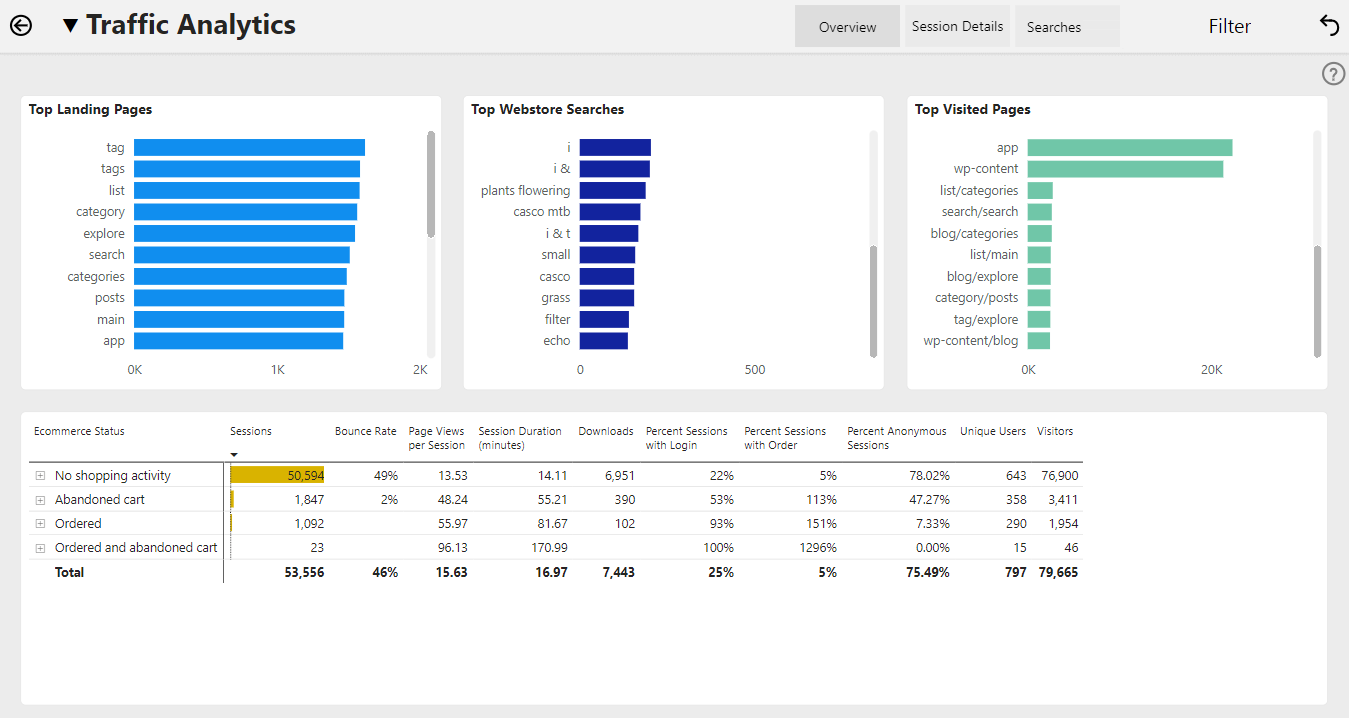
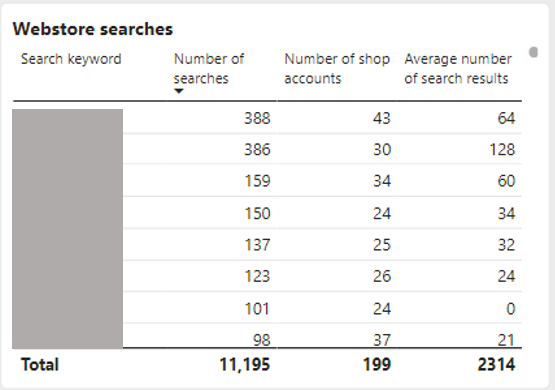
On the Searches subpage, on the top left, you will find a list of all search keywords used by your visitors in internal search in the webstore. The list is exhaustive and starts with the most popular searches. You can also see how many visitors (shop accounts) expressed interest in a particular product or category. In the default view, the report on the Searches subpage is shown for the whole period, but you can filter it by date using the Filter menu on the top right.
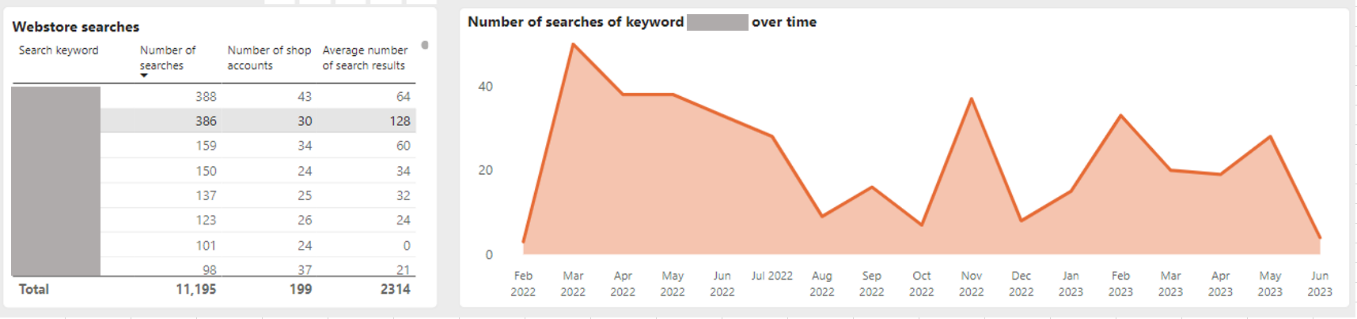
Moreover, you can easily analyse the popularity of each keyword over time. All you need to do is to click on any of the rows in the Webstore searches table and the graph on the right will dynamically change to reflect how many times a certain keyword was used each month. The graph can also be drilled down to the weekly or daily level using the icons that appear on hover to the right of the graph title.
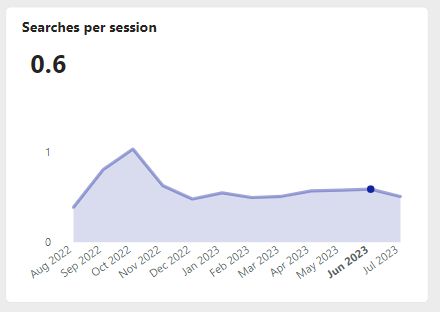
Looking at the data for the first time, you might be unsure if, for example, 1342 searches of all keywords per month is a high number. To help you understand how important searches are for your visitors’ buying journey, we introduced a new measure called Searches per session. If in the Searches per session graph you see that on average every session involves at least one search (searches per session is above 1.0), you might conclude that your users heavily rely on search to find the products they are interested in.
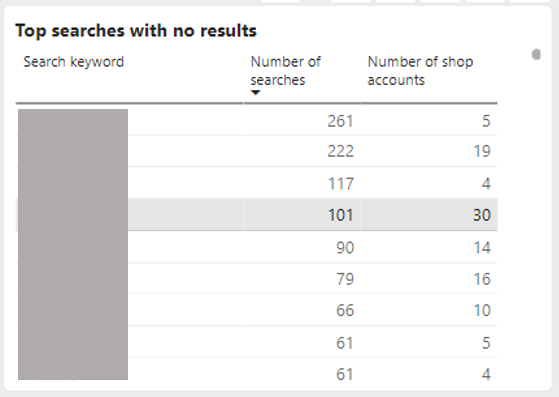
Searching is one thing, but finding the right results is another. Thanks to Sana Commerce Insights you can now see all search keywords that return 0 results in the table called Top searches with no results. For example, a user is looking for a bike, but your company doesn’t sell bikes, so your users will not find anything.
Clicking on the rows in the Top searches with no results table also affects the graph on the top showing how popular that keyword has been over time. Hence, you can conclude whether searches with no results are a big impediment for your users.
The number of search results returned can be tracked starting from Sana Commerce Cloud 1.65. Otherwise, since there is no data the table Top searches with no results will be empty and the column Average number of search results in other tables on the Searches subpage will be also empty.
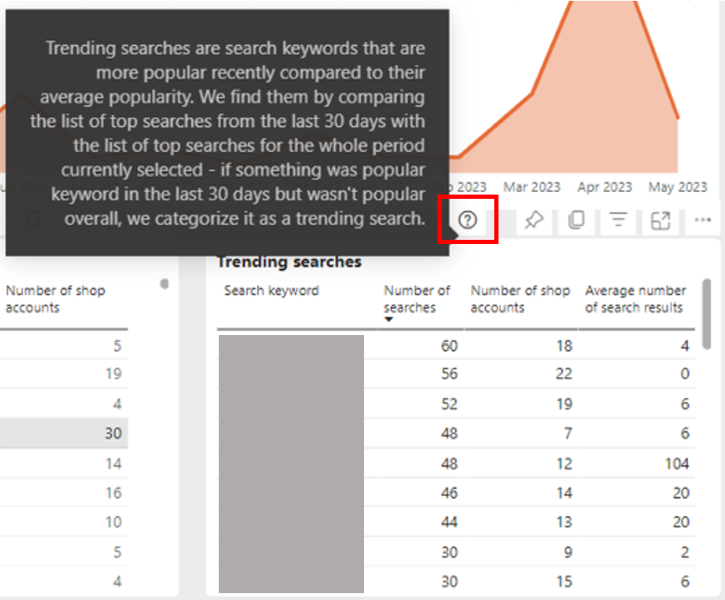
Lastly, we want to give you interesting and advanced insights into searches that have recently gained popularity in your webstore. You can find them in the table called Trending searches located in the bottom right of the Searches subpage. The trending searches can give you a better understanding of market trends and the evolving needs of your customers.
As in other places in the report, the help tooltip explains the algorithm that we use to find trending searches.
Bug Fixes
- Fixed the issue with comparing by Customer County on the Adoption and Retention page.
- Fixed the issue with some shop accounts of sales agents being duplicated in the Shop Accounts table on the Adoption and Retention page.
- Fixed the issue with calculating the View to Basket Conversion Rate graph on the Webstore Optimization page.
- Improved the visual presentation of benchmark highlights and points of improvement when different reference groups are selected.