Sana Commerce Insights 1.20.0
Release date: June 2, 2023
Learn about new features, improvements, and bug fixes in this release.
What’s New?
Access New Improved Insights on the Adoption of Your Webstore
Adoption is the touchstone of e-commerce success and tracking. It will help you not only at the beginning of your e-commerce journey, but also if you are already mature in e-commerce. In this release, we are making available new insights around the behaviour of individual shop accounts empowering you to monitor and influence the successful onboarding of your buyers in the Sana webstore. We are also presenting you with improved KPIs regarding your customers in the ERP.
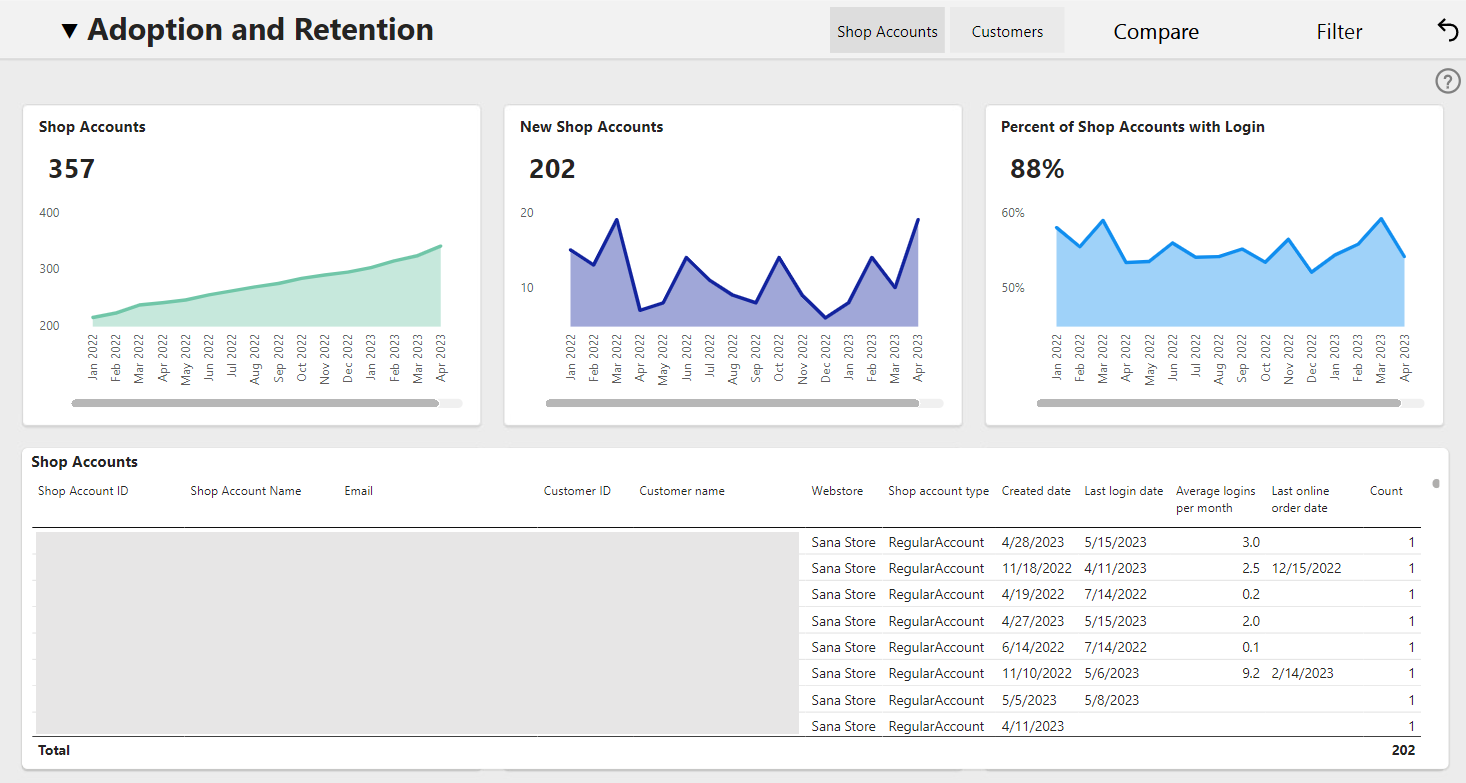
The Adoption and Retention page now consists of two subpages, one dedicated to Shop Accounts.
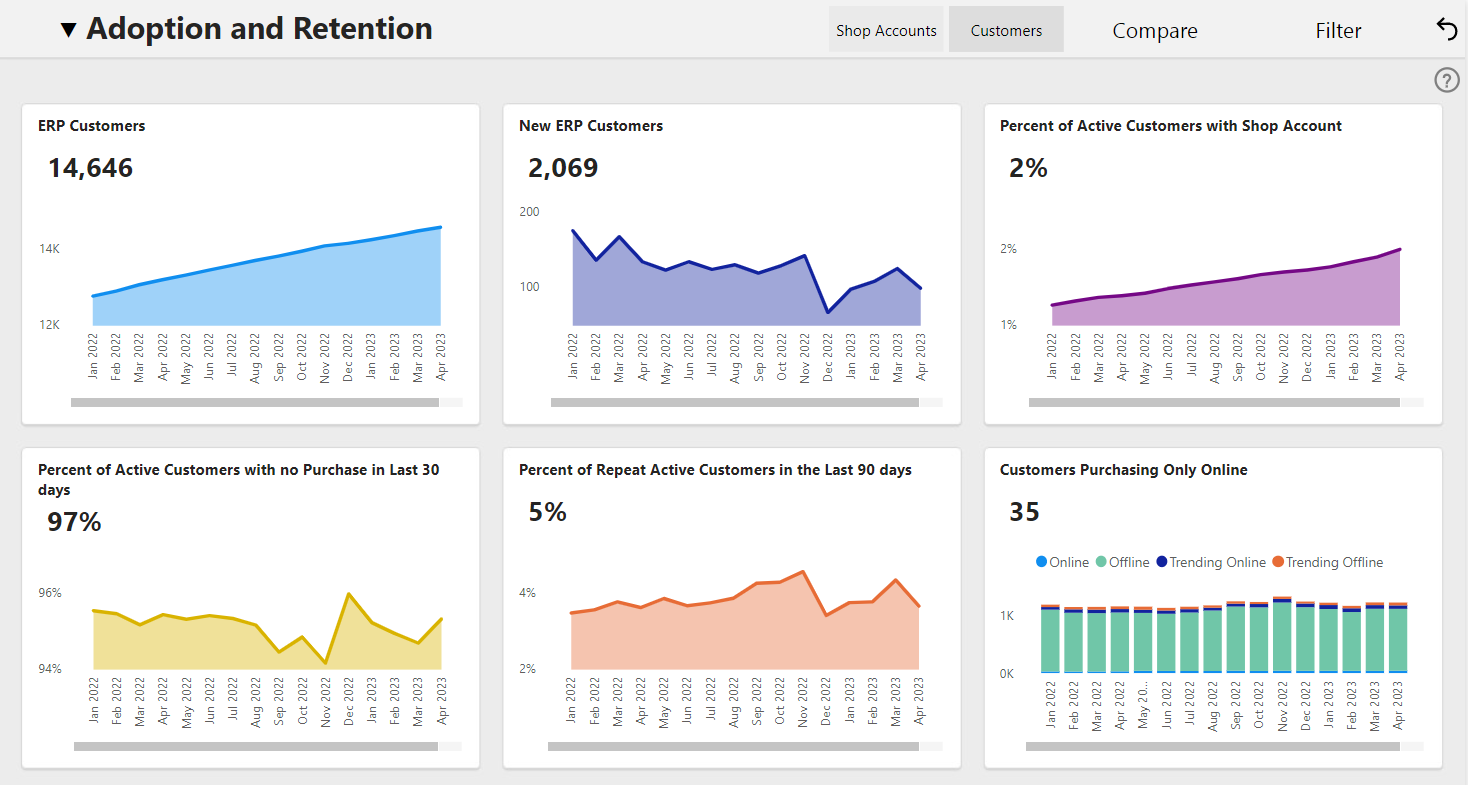
And the other one dedicated to Customers, which refers to the customers registered in your ERP system.
Newly added changes include:
-
A new visual to show the number of new shop accounts created in your webstore.
-
A new table reporting on the behaviour of all active shop accounts such as their creation date, last login date and shop account type. Also, you can easily separate shop accounts that belong to your sales agents by sorting the column Shop account type. Take into consideration that the table and the New Shop Accounts visual are linked. Clicking on any date on the graph will filter the table and a list of shop accounts created in a specific date range will be presented. This is especially relevant if you want to know who the new shop accounts belong to.
-
A new visual showing the number of new customers added in your ERP. This is based on ordering behaviour, under the assumption that a real customer is someone who makes purchases from your business. Therefore, a new customer is added to this visual when they make the first purchase registered in our data.
-
A couple of visuals have slightly different definitions as we calculate them based on active customers instead of all customers in your ERP. Active customers are those who placed an order either online or offline in the last 90 days. With these new measures old, archived, and churned customers are not included in calculations, giving a more useful, accurate picture of your webstore adoption.
-
Percent of ERP Customers with Active Shop Account is renamed to Percent of Active Customers with Shop Account.
-
Percent of ERP Customers with No Purchase in the Last 90 Days is renamed to Percent of Active Customers with no Purchase in the last 30 days. (Note that we changed the time range from 90 to 30 days so this new metric will be higher than the old one).
-
Percent of Repeat ERP Customers in the Last 90 Days is renamed to Percent of Repeat Active Customers in the last 90 days.
You might notice a discrepancy between the columns Last login date and Average logins per month in the Shop Accounts table. For example, Average logins per month might be 0 even though the Last login date is present. This is due to different data sources of these data points. Last login date is tracked on the server side (by Sana) regardless of whether or not a user is blocking cookies, while Average logins per month is tracked on the client side (the user’s browser is sending data) and this data can be unavailable if a user blocks cookies.
Switch Between Reporting Based on the Order Date and the Document Date of the Invoice on the Executive Overview Page
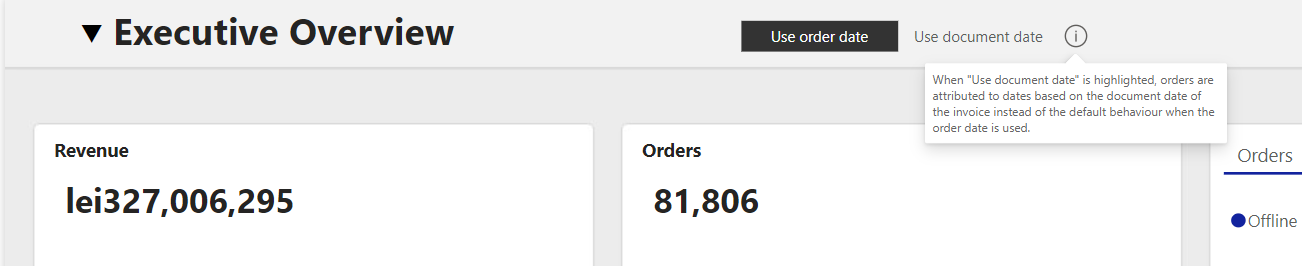
Some of our users shared with us how useful it is to see orders attributed to dates based on the document date (when the order was invoiced) instead of the order date (when the order was placed). This is now possible with a single click.
When you select the option Use document date, the report uses the document date of the invoice to show it in the correct period. For example, an order placed on the 30th of April and invoiced on the 4th of May is by default counted in April, but if you select Use document date, it will show up in May. Important to note that this functionality impacts only the Executive Overview page. When you navigate to other pages of the report, there the order date is always used to produce insights.
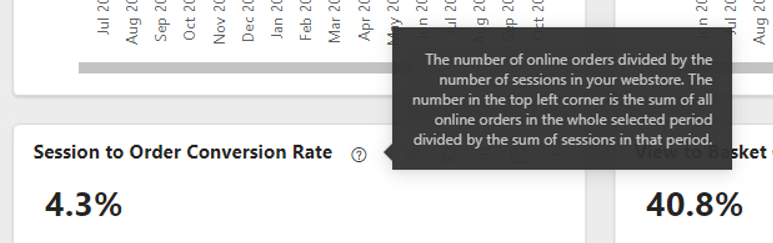
Look Up Definitions of KPIs Directly in the Report With Help Tooltips
In the past Sana Commerce Insights release, we introduced help tooltips which contain information about definitions of the KPIs, available on hover. In Sana Commerce Insights 1.20 we have added more help tooltips and they are now available next to all visuals on the Executive Overview, Webstore Performance, Adoption and Retention, Webstore Optimization and Revenue pages. There is no need to memorize what the metrics measure or refer to the documentation.
Use the New Column Customer Name on the Customer Profiles Page
To expand the use cases of the Posted Invoices and Originating Orders table on the Invoice Details subpage, we have added the Customer Name column. You can now easily access and even download a list of all invoices that Sana Commerce Insights takes into account and their relevant details.
Bug Fixes
- Fixed an issue with the Count column on the Customer Table page which does not include customers without order data.
- Fixed an issue with the Orders visual incorrectly showing a count of invoices instead of orders.
- Fixed small issues with the formatting of metrics on the Benchmarks page.